
Perella Weinberg Partners Rebounds: From Operating Losses to Profitability in 2025
PWP transformed from multi-year operating deficits to a positive operating income in 2025, driven by strategic advisory execution and disciplined capital deployment.
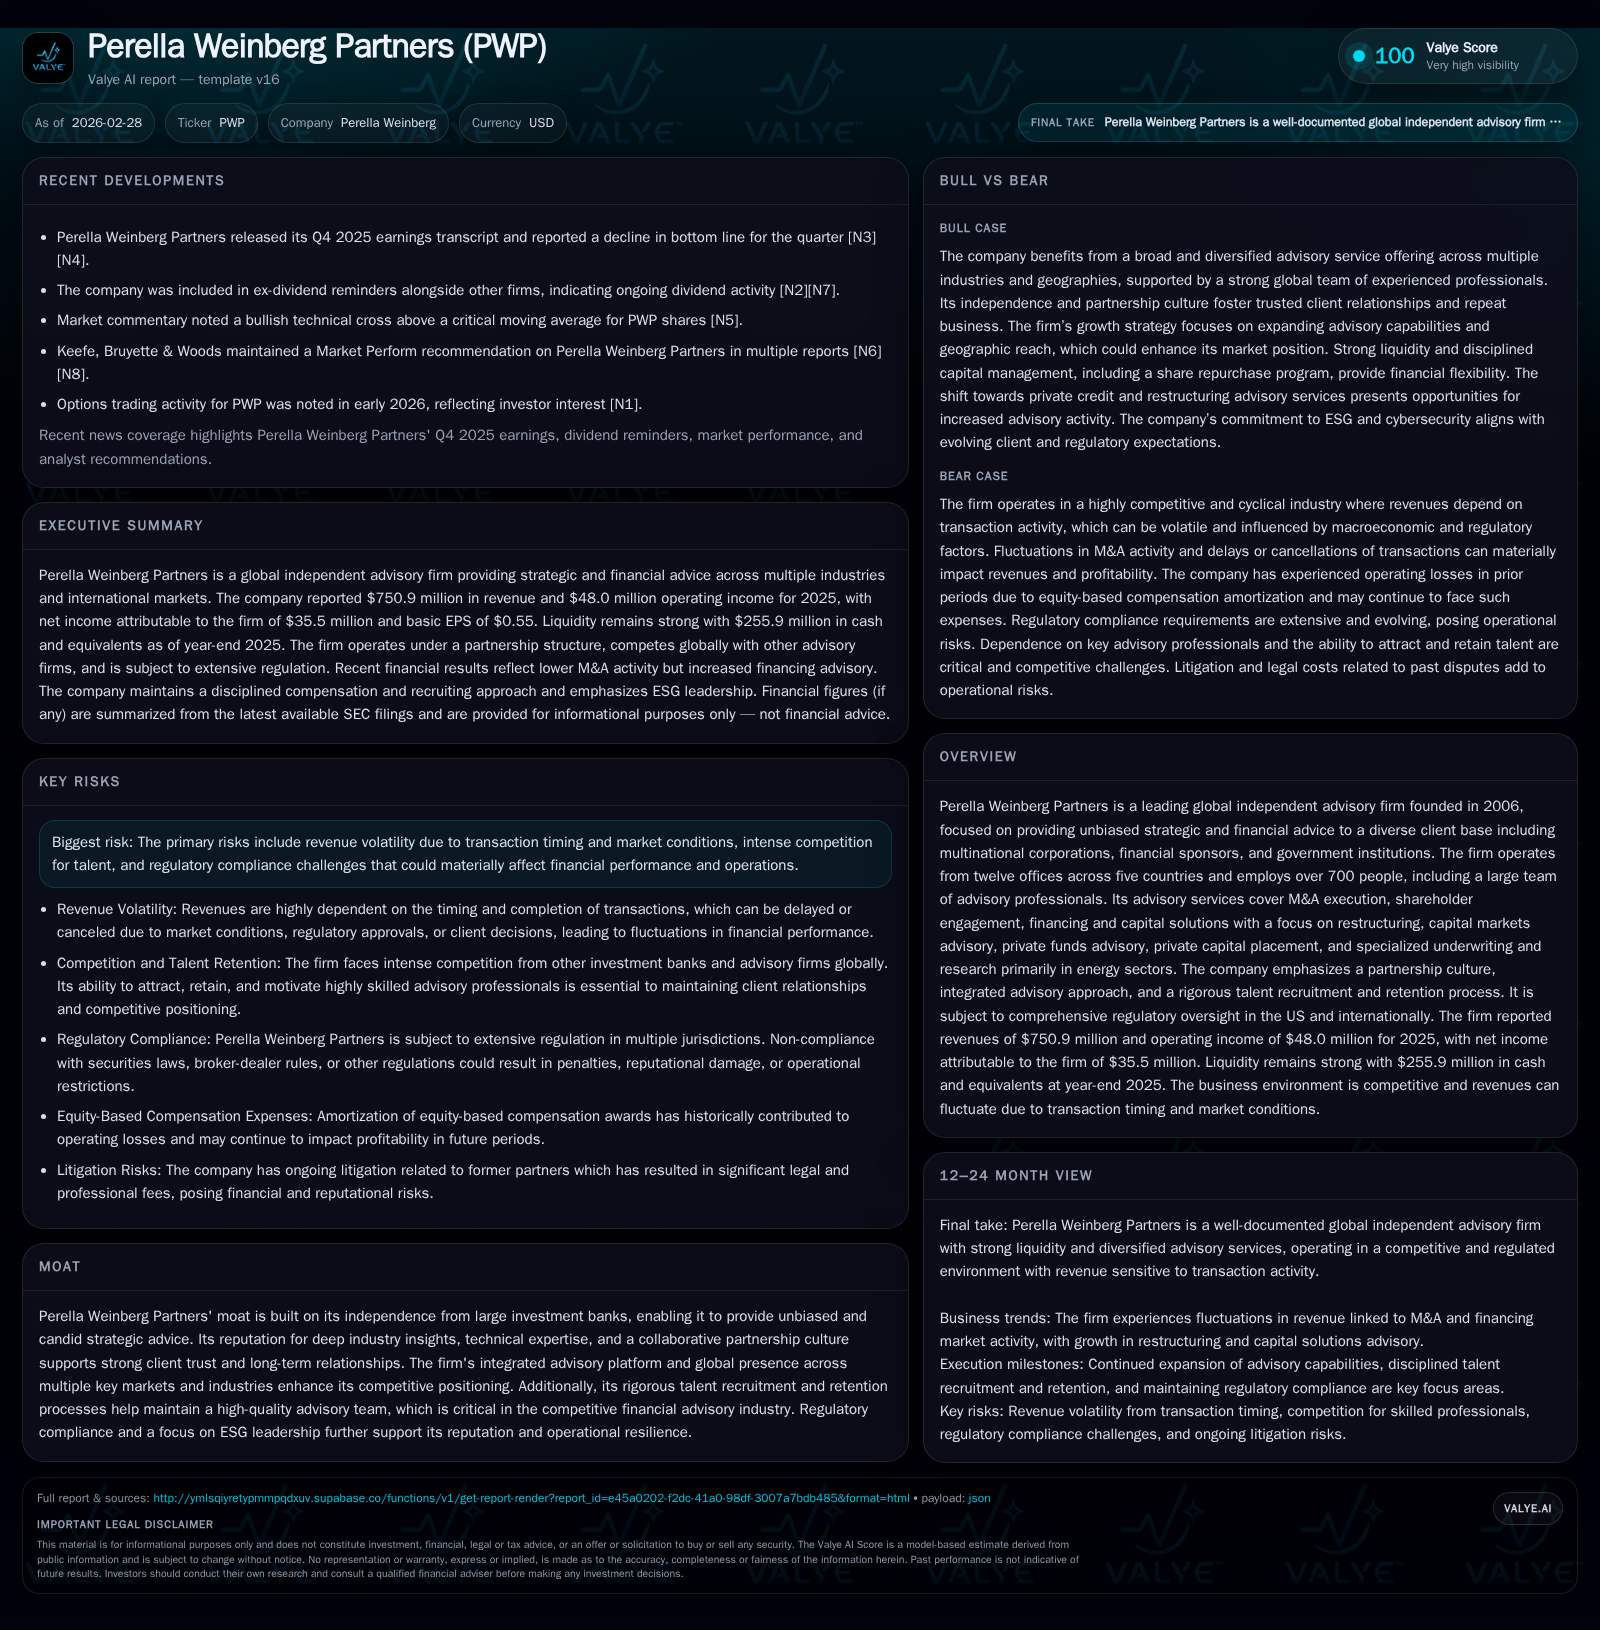
Perella Weinberg Partners reversed a trend of losses spanning 2022 through 2024 with a reported operating income of $48.0 million in 2025. This marked rebound reflects its independent advisory franchise's ability to navigate volatile transaction timing and market conditions. Nevertheless, operational cash flow remained subdued relative to prior years, revealing cash conversion challenges despite profitability. Capital allocation favored shareholder returns via growing dividends and significant share repurchases amidst evolving regulatory and talent retention risks. Forward growth hinges on maintaining deal flow momentum and managing environmental uncertainties intrinsic to advisory services.
Financial Revival: Trends from 2023 Through 2025
Perella Weinberg Partners (PWP) emerged from several consecutive years of operating losses with a marked reversal in fiscal year (FY) 2025. The company reported revenues of $750.9 million for the year ending December 31, 2025, down from $878.0 million in the prior year but well above the $648.7 million posted in 2023 [F1]. Critically, FY2025 delivered an operating income of $48.0 million compared to operating losses of $(78.5) million in FY2024 and $(115.1) million in FY2023 [F1].
This turnaround highlights operational leverage improvements post-completion of amortization schedules tied to equity-based compensation expenses that contributed prominently to earlier losses [S1][S18]. Net income followed suit with a gain of $35.5 million in FY2025 after significant net losses the previous two years [F1].
Despite this positive earnings development, operating cash flow (CFO) contracted sharply to $34.8 million in FY2025 from $223.4 million in FY2024 — a decline of approximately 84% [F1]. This disconnect underscores timing-related volatility between recognized profits and cash collections typical for transaction-dependent advisory models. Capital expenditures (capex) also retreated sharply by nearly three-quarters to $4.3 million from $16.4 million [F1], reflecting reduced infrastructure investment after prior heavy spend.
Historical performance (annual)
| FY | Net ($mm) | CFO ($mm) | OpInc ($mm) | Capex ($mm) | Net YoY |
|---|---|---|---|---|---|
| 2025 | 35 | 35 | 48 | 4 | +154.8% |
| 2024 | -65 | 223 | -79 | 16 | -275.8% |
| 2023 | -17 | 146 | -115 | 58 | -196.3% |
| 2022 | 18 | -18 | -48 | 27 |
Source: SEC companyfacts cache [F1].
Capital returns and efficiency (annual)
| FY | Div ($mm) | Buybacks ($mm) | FCF ($mm) |
|---|---|---|---|
| 2025 | 23 | 34 | 30 |
| 2024 | 20 | 15 | 207 |
| 2023 | 13 | 22 | 88 |
| 2022 | 13 | 68 | -44 |
Source: SEC companyfacts cache [F1].
Note: Operating income YOY % not presented as prior periods were losses.
The Pillars of PWP’s Earnings Turnaround
Management commentary emphasized that the rebound was significantly driven by an improved mix and volume of completed deals alongside enhanced execution capabilities across their diverse advisory services [N1][S1]. The firm's independence from large investment banks allows PWP to provide candid advice free from conflicts of interest—a key differentiator boosting long-term client trust and repeat engagements.
Revenue remains closely tied to transaction closings which can be delayed or terminated due to financing challenges or regulatory hurdles [S1]. However, successful closures in FY2025 notably increased fee generation despite a slight dip in overall revenue versus FY2024 owing partly to uneven quarter-to-quarter deal timing [N1]. Amortization related to Professional Partners Awards equity compensation fully lapsed by the end of FY2024 removing a substantial drag on income [S18].
Advisory Independence as Competitive Advantage
PWP's moat stems primarily from its unencumbered independent advisory model which contrasts with the broader conflicts faced by bulge bracket institutions juggling underwriting and lending businesses [S1]. This independence underpins meaningful client relationships predicated on transparent counsel rather than deal volume incentives.
Its rigorous talent recruitment and retention practices ensure continuity and quality within an advisory workforce of over 700 professionals globally spanning twelve offices [S18]. These attributes combined with compliance excellence amid expanding regulatory regimes fortify reputation—an increasingly critical asset within financial advisory where trust governs premium pricing.
Market Dynamics and Transaction Timing Challenges
The company faces inherent revenue unpredictability linked tightly to completion timings on large transactions that can span extended periods or fall through entirely due to complex regulatory approvals or market shifts [S1][S2]. Furthermore, client churn driven by M&A or leadership changes requires constant pipeline replenishment through networking and hiring senior advisors.
Segmentation of revenue streams by product type is impractical given PWP's holistic advisory methodology where cross-functional expertise across M&A execution, restructurings, capital markets advice and private placements blends seamlessly into engagements [S1]. This integrated approach is both competitive strength and reporting complexity source.
Capital Allocation: Dividends, Buybacks, and Cash Flow Management
Notwithstanding CFO volatility, PWP has aggressively pursued shareholder return initiatives supporting dividends and share repurchases amid cash flow constraints [F1][S12]. Dividends increased modestly to approximately $22.9 million in FY2025 from $20.3 million the prior year while share repurchases more than doubled reaching $33.7 million compared to $15 million in FY2024 [F1].
Liquidity remains robust supported by $256 million cash equivalents as of year-end with no outstanding borrowings against a committed revolving credit line of up to $70 million facility capacity [S5][S9]. Capital expenditure discipline post major investments enables positive free cash flow generation with an estimated FCF near $30 million driven by tight working capital management despite CFO dips [F1].
Return on equity appears negative around -8% for FY2025 reflecting equity valuation swings including non-cash items linked to complex incentive arrangements rather than pure operational performance metrics [F1].
Forecasting Future Growth and Operational Constraints
Looking forward, growth prospects hinge chiefly on sustaining deal flow volume amidst uncertain macroeconomic environments influencing M&A activity levels [N1][S10]. Intensifying competition for senior advisors could challenge expansion plans requiring continued investment in talent.
Regulatory scrutiny heightens complexity especially across multiple jurisdictions where compliance costs weigh further on profitability margins [S10][S19][S20]. The firm's litigation matter dating back nearly a decade involving former partners remains unresolved but is not expected presently to inflict material adverse financial consequences though it requires monitoring given potential reputational impacts [S10][S19][S20].
Regulatory Environment and Risk Factors Affecting Outlook
PWP faces stringent U.S. and international regulations governing broker-dealer activities including antimoney laundering controls that demand ongoing investments in policies, monitoring systems, training programs, and audits [S19]. Regulatory lapses could trigger sanctions damaging brand value.
The firm's focus on ESG leadership helps mitigate reputational risks while robust governance frameworks aim to address evolving compliance demands swiftly minimizing operational disruption risks [S10][S19]. Nonetheless the cyclical nature of fee income stemming from transaction dependencies continually injects earnings volatility.
What Investors Should Watch Next
Key indicators warrant tracking include the pace at which high-value transactions close each quarter given their outsized influence on fee recognition timing [N1]. Market conditions affecting capital markets business lines such as underwriting demand also serve as bellwethers for near-term revenue sustainability.
Additionally, monitoring liquidity trends including cash generation relative to planned dividend payments and share repurchase program scale will reveal management's confidence level regarding sustainable free cash flows amidst external uncertainties [N3][S12]. Progress resolving or any developments regarding legacy litigation may further sway perception but currently remain background matters.
This analysis synthesizes Perella Weinberg Partners' trajectory through publicly available SEC filings and recent public disclosures without projecting investment recommendations or price targets. All numerical data reflect audited historical performance without extrapolation beyond reported figures.
Disclaimer: This is research-only, informational analysis and not investment advice. It may include AI-generated interpretation and general industry context. Always verify important details using primary sources.

Comments