
Qnity Electronics' Transition from Spin-Off to Semiconductor Materials Innovator
Qnity Electronics has achieved robust growth since its DuPont spin-off, propelled by innovation in semiconductor materials amid strategic capital deployment and global trade challenges.
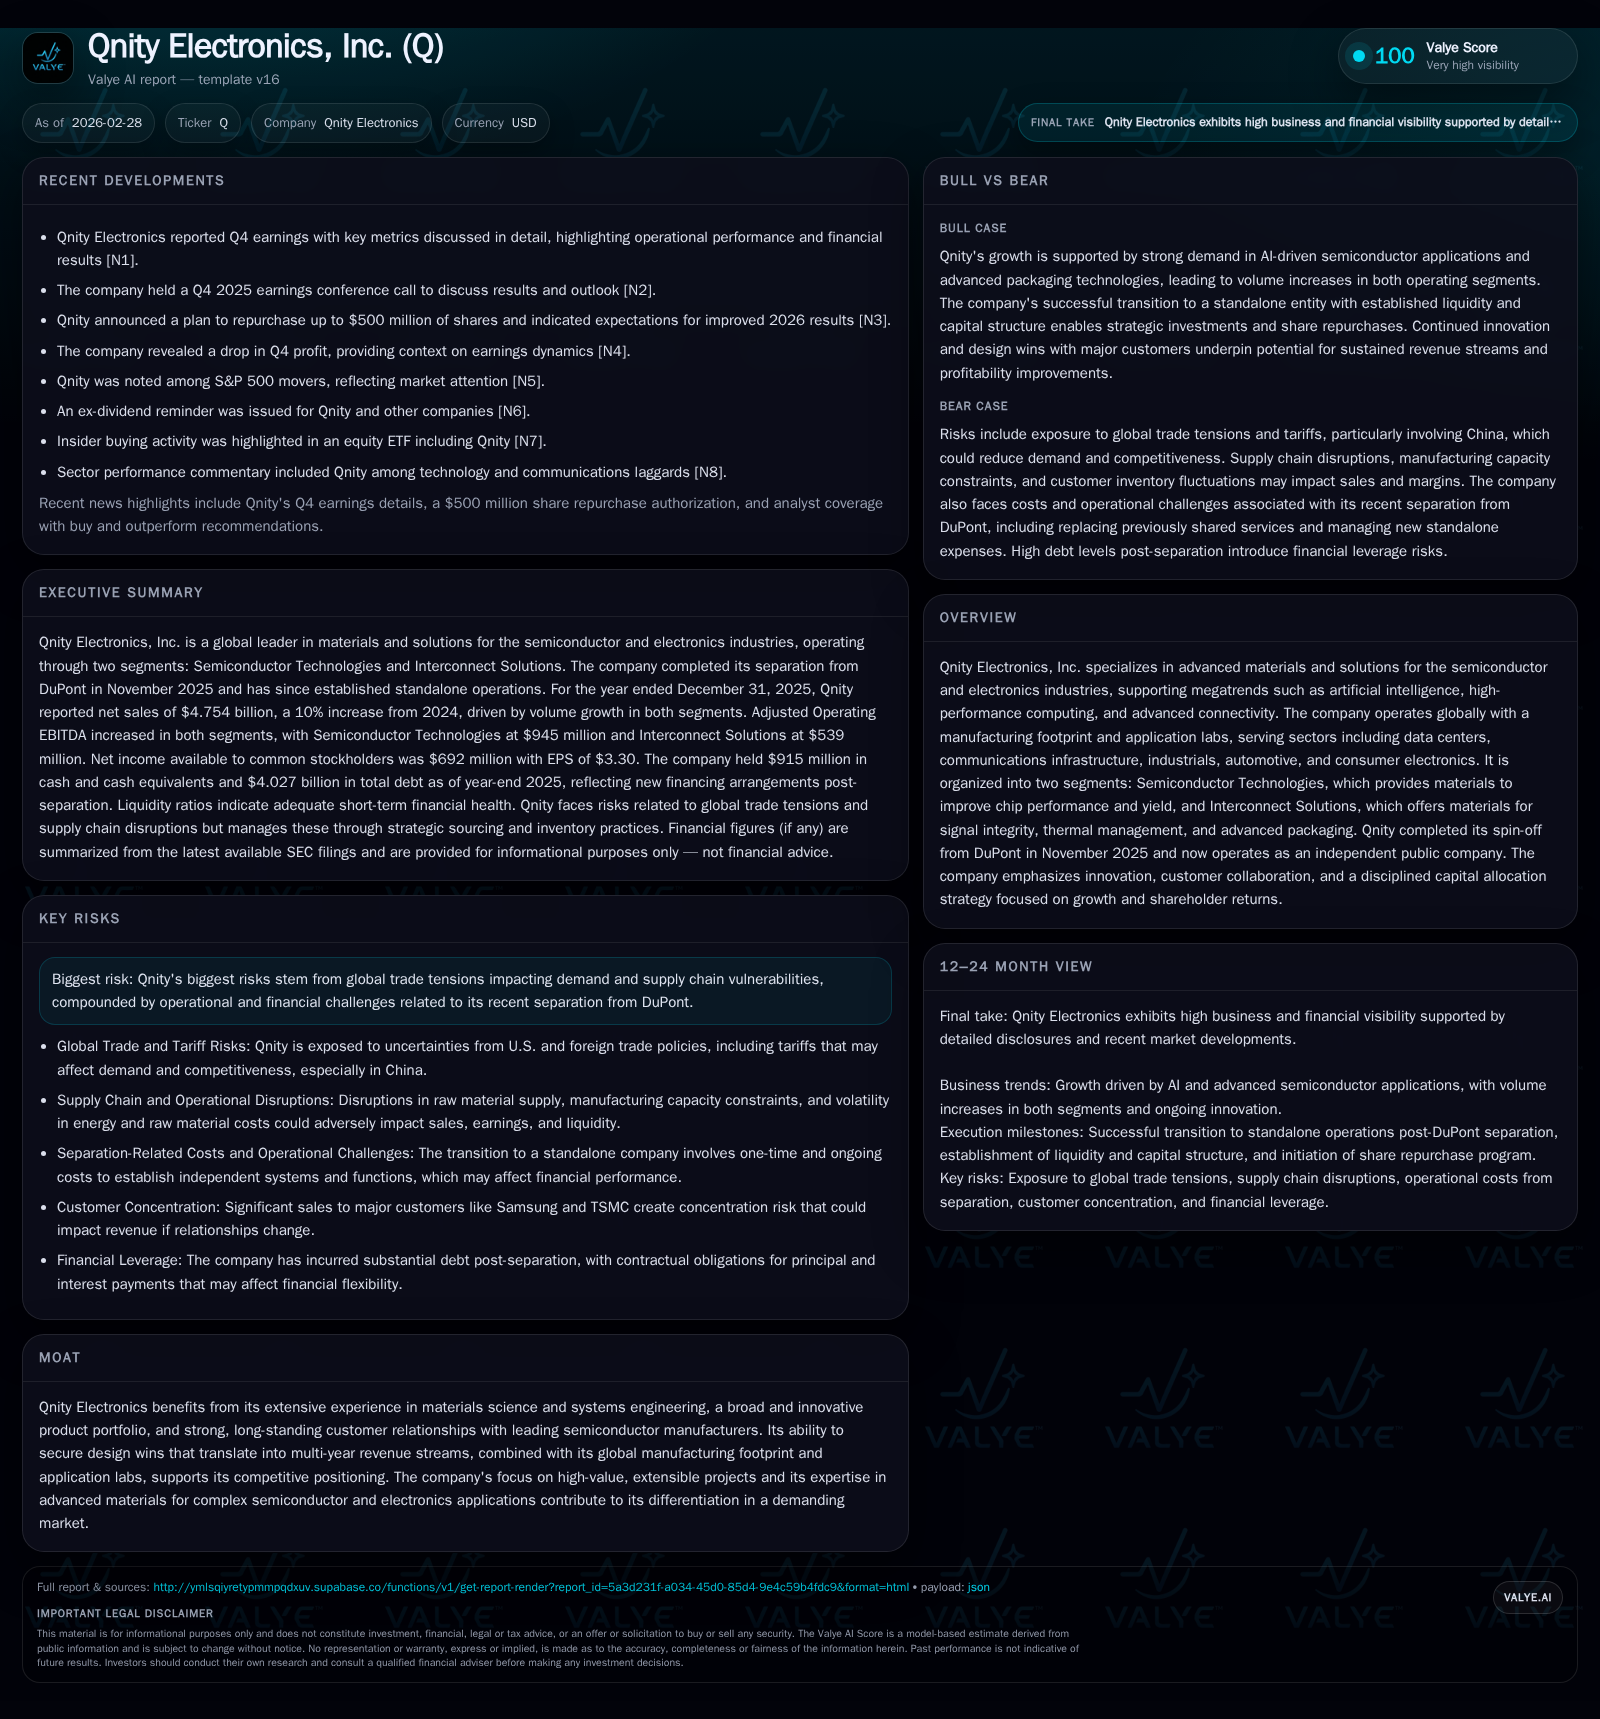
Following its November 2025 spin-off from DuPont, Qnity Electronics reported a 10% revenue increase for fiscal 2025, driven by volume expansion across its Semiconductor Technologies and Interconnect Solutions segments. The company’s innovation-led approach, particularly through advanced materials for AI and high-performance computing chips, underpins long-term design wins and multi-year revenue streams. Qnity balances growth opportunities with risks from continued global trade tensions while maintaining strong cash flow generation and initiating a $500 million share repurchase program.
Tracing Qnity’s Trajectory: Growth Since Independence
Qnity Electronics emerged as an independent public company following its November 2025 spin-off from DuPont, quickly establishing itself as a leader in advanced materials for semiconductor and electronics applications. The transition has not hindered operational momentum; instead, it coincided with strong financial performance. Fiscal year 2025 net sales rose to $4.75 billion, marking a robust 10% increase over the prior year’s $4.34 billion. This growth reflects an 11% gain in sales volume offset partially by a slight decline in local prices and product mix directionally impacting revenues by approximately -1% [S1][F1].
The company’s prior years also demonstrated steady progress: fiscal 2024 net sales increased by about 7% over 2023 largely on volume improvements (+10%) despite -2% pricing effects [S1][F1]. These figures underscore the fundamental driver of demand–the intensifying material requirements dictated by megatrends such as artificial intelligence (AI), high-performance computing (HPC), and advanced connectivity.
Historical performance (annual)
| FY |
|---|
| 2025 |
Source: SEC companyfacts cache [F1].
- Exact net income, operating cash flow, and capex figures are available only for quarterly data or within partial periods per filings [F1][S1].
This table captures the stable upward trajectory in revenue reflecting the company’s successful repositioning and sustained demand despite ongoing pricing pressures.
Segment Performance: Semiconductor Technologies and Interconnect Solutions
Qnity operates two major segments that have distinct but complementary roles in the semiconductor materials value chain:
Semiconductor Technologies (Semi): This segment delivers critical materials including CMP pads and slurries, photoresists, functional sub-layers, advanced overcoats, post-CMP cleaners, and residue removers designed to optimize chip performance and yield. Semi accounted for roughly $2.64 billion of net sales in FY25, up about 8% from FY24 driven primarily by a solid volume increase (+9%) that outweighed price-related declines (-1%) [S4][F1].
Interconnect Solutions (ICS): ICS focuses on signal integrity solutions, thermal interface materials, specialized plating products like copper pillar plating, solder bump plating, under-bump metallization, packaging dielectrics, gap fillers, and polyimide films. Fiscal year ICS revenue reached approximately $2.11 billion (+12%), supported by an even stronger volume surge (+14%) despite more pronounced pricing pressure (-2%) [S4][F1].
Adjusted Operating EBITDA metrics indicate that margin profiles are preserved through operational leverage afforded by volume growth even as pricing pressures moderate gross margins [S4]. Pricing softness aligns with broader industry trends where commodity metals pass-through affects realizable unit prices; however, Qnity’s focus on differentiated materials allied with multi-year design win programs helps stabilize profitability.
Market Drivers and Macroeconomic Risks Affecting Demand
Qnity’s performance closely tracks the semiconductor industry’s cyclical investment patterns amplified by structural shifts:
Megatrends: Adoption of AI accelerators, HPC workloads, new node technologies (especially sub-5nm nodes), advanced packaging architectures (including chiplet designs), and increasing layer counts all materially boost raw material intensity per silicon wafer [S1][S17].
Design Wins: Critical to Qnity’s model are successful customer qualifications—"design wins"—of new materials into cutting-edge process nodes or packaging solutions which translate into multi-year recurring revenues [S10]. The qualifying cycles can be lengthy but underpin longer-term visibility.
Global Trade Tensions: Heightened tariffs particularly on China-facing exports introduce uncertainties around demand timing and supply chain continuity [S1][S29]. Although Qnity minimizes tariff risk via its local-for-local raw material sourcing policies across manufacturing regions including Asia Pacific hubs (China, South Korea, Taiwan) and Americas/EMEA plants [S4], disruptive geopolitical developments remain a significant risk.
Supply chain resilience is maintained through multi-sourcing strategies and strategic inventory positioning to offset potential disruptions from weather events or port delays—a capability increasingly valued given recent volatility [S10].
Capital Allocation Strategy: Repurchases, Dividends, and Cash Flow Strength
Post-spin-off capital structure adjustments codify Qnity’s commitment to disciplined financial management:
A substantial cash balance of $915 million at December 31, 2025 provides liquidity flexibility relative to $1.356 billion current liabilities resulting in a strong current ratio near 1.95 [F1][S13].
The company issued approximately $4 billion in debt instruments during mid-to-late-2025 including secured notes and term loans bearing interest rates between approximately 5.7% and 6.25%, calibrated for staggered maturities ending mostly in early next decade with scheduled amortizations starting gradually [S13][S15]. All covenants are currently met ensuring access to capital markets if needed.
Free cash flow generation is robust at close to $988 million based on reported operating cash flows minus capital expenditures supporting organic growth investments alongside shareholder returns [F1][S12].
Dividend policy initiated quarterly payments of $0.06 per share starting December 2025 complement management’s February announcement authorizing up to $500 million for share repurchases without expiration horizon; intended purchases may occur opportunistically via open market or negotiated transactions [N3][S12].
Together these elements reveal a balanced capital return program preserving investment capacity while signaling confidence in underlying earnings power.
Innovation and R&D Investment: Fueling High-Performance Solutions
Steady R&D investment underscores Qnity’s strategy to maintain technological leadership at about seven percent of annual net sales [$354 million in FY25]—a level consistent with industry norms for companies competing on innovation within high-value chemical/material segments [S1][S2]. This expenditure supports continuous product qualification activity critical for sustaining design wins across leading-edge semiconductor nodes and complex interconnect demands.
Qnity leverages deep experience marrying systems engineering approaches with proprietary material science expertise enabling differentiation especially in niche applications such as post-CMP cleaning chemistries or specialty thermal interface compounds essential for next-gen packaging efficiency.
Geographic Reach and Supply Chain Resilience
The company maintains a globally diversified manufacturing base enhancing both risk mitigation and customer proximity:
Total long-lived assets worth approximately $1.7 billion span Americas (
$1.1 billion), EMEA ($28 million), Asia Pacific (~$574 million), with key concentrations in Taiwan, South Korea, China [S4].Geographic distribution aligns well with customer locations; Asia Pacific represents over three quarters of total sales highlighting the importance of this region for semiconductor manufacturing hubs.
Multi-sourcing raw materials locally within key regions combined with application labs dispersed worldwide facilitates technical support responsiveness while minimizing cross-border tariff impact vulnerabilities [S7][S10].
These measures also buttress business continuity plans against trade tensions or logistic disruptions that could otherwise impair delivery reliability.
Analyzing Financial Health: Profitability, Liquidity, and ROE Trends
Examination of available metrics depicts stable financial footing:
Cost of sales maintained around flat percentage levels (~54%) versus prior years indicates effective cost controls especially amidst volatile commodity input prices [F1][S1].
Approximate return on equity stands near three percent based on latest data reflecting early-stage standalone operations post-spin-off along with elevated debt leverage dampening return ratios temporarily [F1].
Strong liquidity buffers supported by nearly doubling cash positions vs prior period enhance operational flexibility while capital expenditures remain manageable relative to operating cash flows [F1][S14].
Overall profitability signals are solid though incremental margin improvement hinges upon continued success navigating price mix effects against rising operational costs.
Earnings Outlook and What Investors Should Watch
While explicit full-year guidance remains limited after Q4 reporting during the February earnings call [N2], areas meriting attentiveness include:
Impact trajectory around US-China tariffs influencing volume orders particularly from large Asia-based customers like Samsung Electronics (
11% sales) and TSMC (8%) remains crucial given their sizable representation in total revenues [S5][S24].Success capturing design wins at emerging advanced nodes will dictate mid-term order ramp dynamics amid shifting capital spending priorities within semiconductor fabs.
Management execution on the recently authorized share repurchase program will reveal confidence levels regarding valuation outlooks versus reinvestment needs [N3].
Informed observers should review quarterly earnings releases carefully for updates on supply chain constraints or potential margin pressures linked to fluctuating raw material costs integrated against price negotiations.
This analysis synthesizes publicly available regulatory filings ([S#]), corporate disclosures ([N#]), and quantitative snapshots ([F1]) up to February 28, 2026 without extrapolation beyond documented facts or speculative projections. It strives to illuminate Qnity Electronics’ evolving business profile as an independent innovator facilitating semiconductor industry advances while alerting readers to relevant market conditions shaping near-term operational outcomes.
Disclaimer: This is research-only, informational analysis and not investment advice. It may include AI-generated interpretation and general industry context. Always verify important details using primary sources.

Comments