
QuickLogic Corp Faces Growth Challenges from Customer Concentration and Manufacturing Dependencies
QuickLogic’s declining revenues and widening losses contrast with its technological niche and capital maneuvers amid industry headwinds.
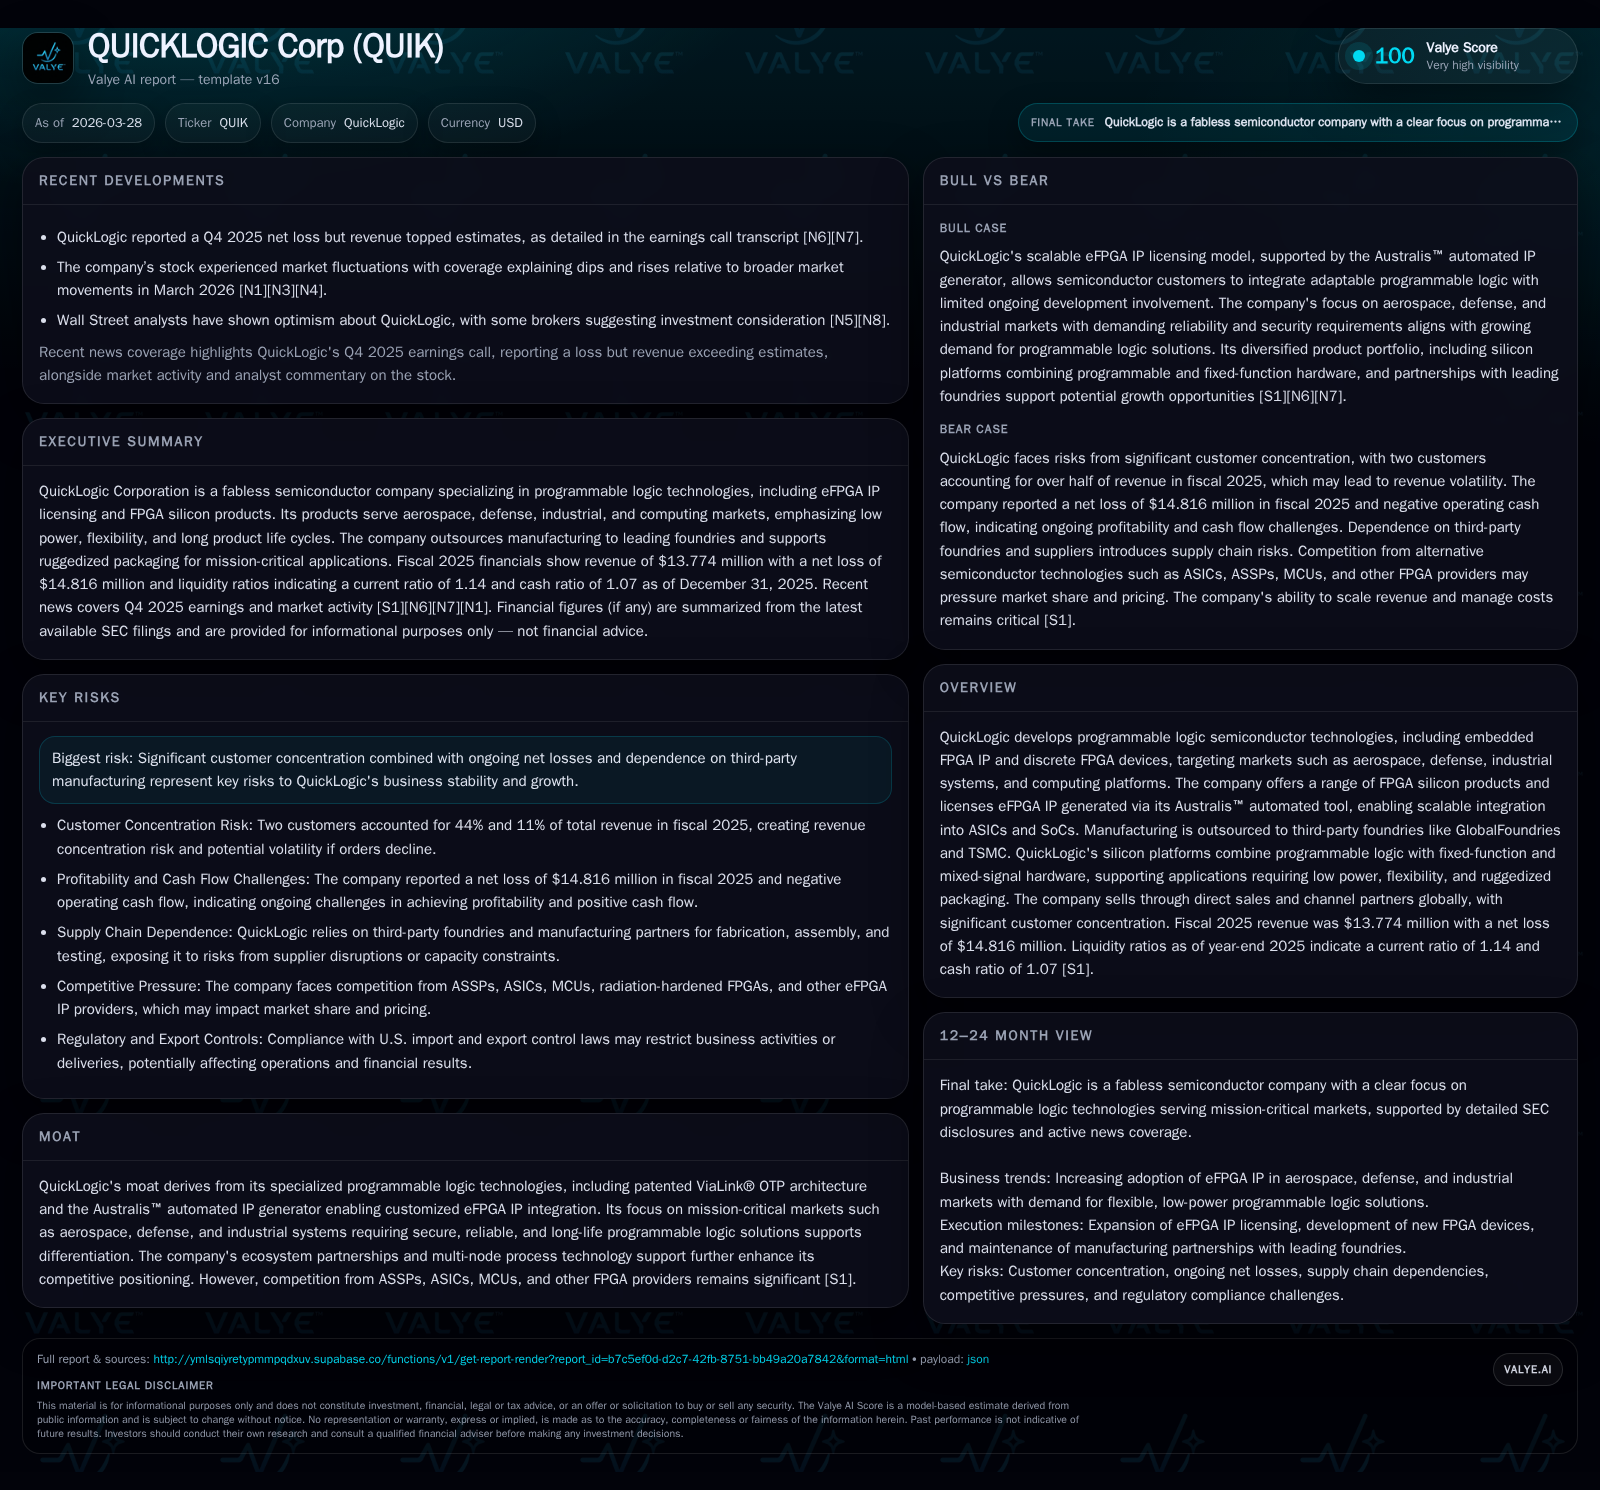
QuickLogic Corporation, a fabless semiconductor specialist focused on programmable logic technologies such as eFPGA IP and discrete FPGAs, reported revenue of $13.774 million and a net loss of $14.816 million in fiscal 2025 [F1]. Despite a 6.4% year-over-year revenue growth, gross margins contracted sharply due to rising costs and inventory issues [S8]. The company’s customer concentration risk is substantial, with two clients accounting for 55% of revenue in 2025 [S9]. Liquidity appears adequate in the near term due to available credit facilities and recent equity raises, but persistent operating losses and dependency on third-party foundries pose ongoing risks [S4][S10][S25]. QuickLogic’s moat is rooted in patented architecture and automated IP generation tools serving aerospace, defense, and industrial sectors demanding long product lifecycles and security features [S1].
Company Overview
QuickLogic Corporation has built a specialized niche in programmable logic semiconductor technologies since its founding in 1988. As a fabless semiconductor developer headquartered in San Jose, CA, QuickLogic offers embedded FPGA IP (eFPGA) licensing as well as discrete FPGA devices designed for adaptability, low power consumption, and long product life cycles—features tailored for application areas such as aerospace, defense, industrial systems, computing platforms, and edge computing.
The company's product ecosystem spans silicon FPGA platforms like EOS™, ArcticLink® III, PolarPro® series, legacy PASIC®3 devices, programming hardware, design software tools, and critically the Australis™ automated IP generator that enables scalable customization of eFPGA blocks into ASICs or SoCs [S1]. These technologies provide customers deterministic hardware operation, security assurances, and longevity demanded by mission-critical uses.
Manufacturing is fully outsourced to leading third-party foundries including GlobalFoundries and TSMC—a standard practice that entails tradeoffs around control over supply chain stability amid semiconductor market cyclicality [S1][S9]. QuickLogic sells globally via direct sales teams complemented by channel partners serving North America, Europe, Asia Pacific regions.
Historical Performance
QuickLogic's most recent fiscal year (2025) financial snapshot reveals ongoing challenges despite modest topline improvement. Revenue rose to approximately $13.774 million representing a 6.4% increase over fiscal 2024 ($12.942 million estimated by reverse calculation from YoY %), yet the gross profit plummeted sharply due to rising cost of revenue which increased by roughly 42% year-over-year [F1][S8]. This margin contraction reflects higher compensation expense aligned with executing complex contracts, tooling-related depreciation on pre-production assets for subject-specific semiconductor manufacturing needs, as well as additional reserves booked against wafer inventory values that faced obsolescence risk amid evolving IoT product cycles.
Net losses widened dramatically to $14.816 million in fiscal 2025 from a loss of $3.841 million in the prior year—an indicator of deteriorating operational leverage aggravated by uneven revenue streams concentrated among very few customers who account for more than half of sales (44% for one major client and another at roughly 11%) exposing volatility risks if these relationships falter [F1][S9].
Cash flow trends also turned negative: operating cash flow fell to $(3.26) million compared with a mild positive $27 thousand prior year; capital expenditures decreased versus prior years but still consumed about $3.16 million reflecting investments in internal-use software development alongside property equipment purchases needed for new product rollouts [F1][S11][S24].
Historical performance (annual)
| FY | Net ($mm) | CFO ($mm) | OpInc ($mm) | Capex ($mm) | Net YoY |
|---|---|---|---|---|---|
| 2025 | -15 | -3 | -12 | 3 | -285.7% |
| 2024 | -4 | 0 | -3 | 5 | -1360.5% |
| 2023 | 0 | 5 | 0 | 5 | +93.8% |
| 2022 | -4 | -4 | -4 | 0 |
Source: SEC companyfacts cache [F1].
Capital returns and efficiency (annual)
| FY | FCF ($mm) | ROE% |
|---|---|---|
| 2025 | -6 | -65.9 |
| 2024 | -5 | -15.4 |
| 2023 | -1 | -1.6 |
| 2022 | -4 | -35.9 |
Source: SEC companyfacts cache [F1].
*Estimated based on YoY % reported [F1]
Future Growth Prospects
Growth drivers for QuickLogic hinge on expanding adoption of its embedded FPGA IP licensing among semiconductor companies designing ASICs or SoCs that require customizable programmable blocks without incurring full FPGA complexity or power consumption overheads [S1]. The Australis™ tool suite is critical here—enabling faster integration speed and scalability across multiple technology nodes including advanced Intel and TSMC processes promotes technical competitiveness.
Further opportunities exist tapping increasing demand from aerospace & defense markets where secure radiation-hardened FPGA functionality can support trusted microelectronics initiatives backed by government programs seeking supply chain resilience [S1]. Additionally industrial automation trends prioritize long-life solution deployments amenable to configurable hardware acceleration minimizing fixed-function replacements.
However, constraints include significant customer concentration making incremental revenue streams lumpy; competition from established FPGA manufacturers offering large-scale programmable logic families; alternative ASSPs or MCUs commoditizing some programmable functions; plus the challenges inherent outsourcing manufacturing which complicates responsiveness to rapid shifts in customer orders given longer lead times compared to delivery requests [S9][S27].
There is no explicit financial guidance or upcoming milestones disclosed yet; upcoming quarters should be monitored closely for revenue composition shifts away from top customers or signs of expansion into new applications domains as well as rollout pace of any next-generation platform updates mentioned during earnings calls but currently unspecific [N1][N2] (analysis).
Returns & Capital Allocation
QuickLogic operates under persistent net losses resulting in negative returns on equity—for fiscal year ended December 28, 2025 the approximate ROE stands near -66%, emphasizing challenging profitability dynamics given cumulative equity bases versus widening net losses reported annually [F1]. Operating cash flows turned negative signaling cash burn despite attempts at cost control.
On capital deployment fronts the company has moderated capex spend after higher investments during build-out phases seen earlier years though continues to capitalize internally developed software essential for evolving its design tools ecosystem [F1][S24][S26]. Liquidity management includes drawdowns under a revolving credit facility with Heritage Bank capped initially at $20 million but with current outstanding around $15 million bearing interest near prime plus half percent rates, maturities set through end-2026 with plans underway for renewal or refinancing via Sunflower Bank providing potential leeway beyond one-year horizon [S6][S7][S10].
Equity offerings have supplemented cash resources recently: the Fiscal Year 2025 stock issuances raised nearly $8.7 million net proceeds via direct registered offerings plus ATM sales agreements facilitating occasional share placements without dilutive price shocks—these transactions help offset working capital needs especially given uneven operating cash inflows [S10][S12][S17].
No dividends or buyback programs have been conducted reflecting prudent preservation stance given internal losses and capital-intensive growth investments required.
Industry Context & Competitive Positioning (Analysis)
Within programmable logic semiconductors sector serving mission-critical embedded systems, QuickLogic differentiates through its ViaLink® OTP patented architecture enabling one-time programmable devices integrated into complex ASICs reducing traditional FPGA overheads while maintaining configurability advantages necessary under defense-grade reliability standards.
The Australis™ automated embedded FPGA core generation tool provides a significant engineering productivity boost permitting customers accelerated time-to-market—a salient advantage when contrasted against manual IP customization historically prevalent across smaller eFPGA providers.
Despite these strengths the firm must navigate intense competition—not only from mainstream large FPGA vendors like Xilinx (AMD), Intel/Altera offering broad portfolios potentially benefiting from mega-foundry scale—but also emerging ASSPs targeting IoT edge compute markets potentially compressing addressable programmable silicon demand segments requiring low power yet reduced complexity solutions.
Furthermore supply chain realities including dependency on a handful of foundry partners with wafer allocation constraints could exacerbate vulnerability during global chip shortages or shifting geopolitical trade restrictions impacting technology exports involved in defense/agencies contracts compliance frameworks.
Summary & Outlook Considerations
QuickLogic Corp rests at an inflection where distinct technological moats provide a foundation for long-term relevance yet significant near-term headwinds manifest through profitability erosion intensified by cost inflation factors and high client dependency concentration.
Maintaining access to sufficient liquidity via credit lines coupled with capital raises will be pivotal as research & development efforts persist toward next-generation silicon platforms promising improved integration efficiencies and enhanced eFPGA IP appeal especially within secured government-funded programs.
Quarterly updates will reveal if diversification strategies mature effectively to mitigate order volatility linked to dominant customers or if external macroeconomic stresses further pressure margins creating renewed financing urgency.
This analysis aims to present an informed assessment strictly grounded in publicly filed data sources without prescribing investment actions or specific forecasts beyond documented disclosures.[F1][N1]-[N12][S1]-[S29]
Disclaimer: This is research-only, informational analysis and not investment advice. It may include AI-generated interpretation and general industry context. Always verify important details using primary sources.
Comments