
Ultragenyx’s Operating Losses Persist Despite Revenue Growth and Gene Therapy Pipeline Progress
The rare disease specialist reported higher revenues in 2025 but continues to face substantial operating losses amid costly R&D and commercialization efforts.
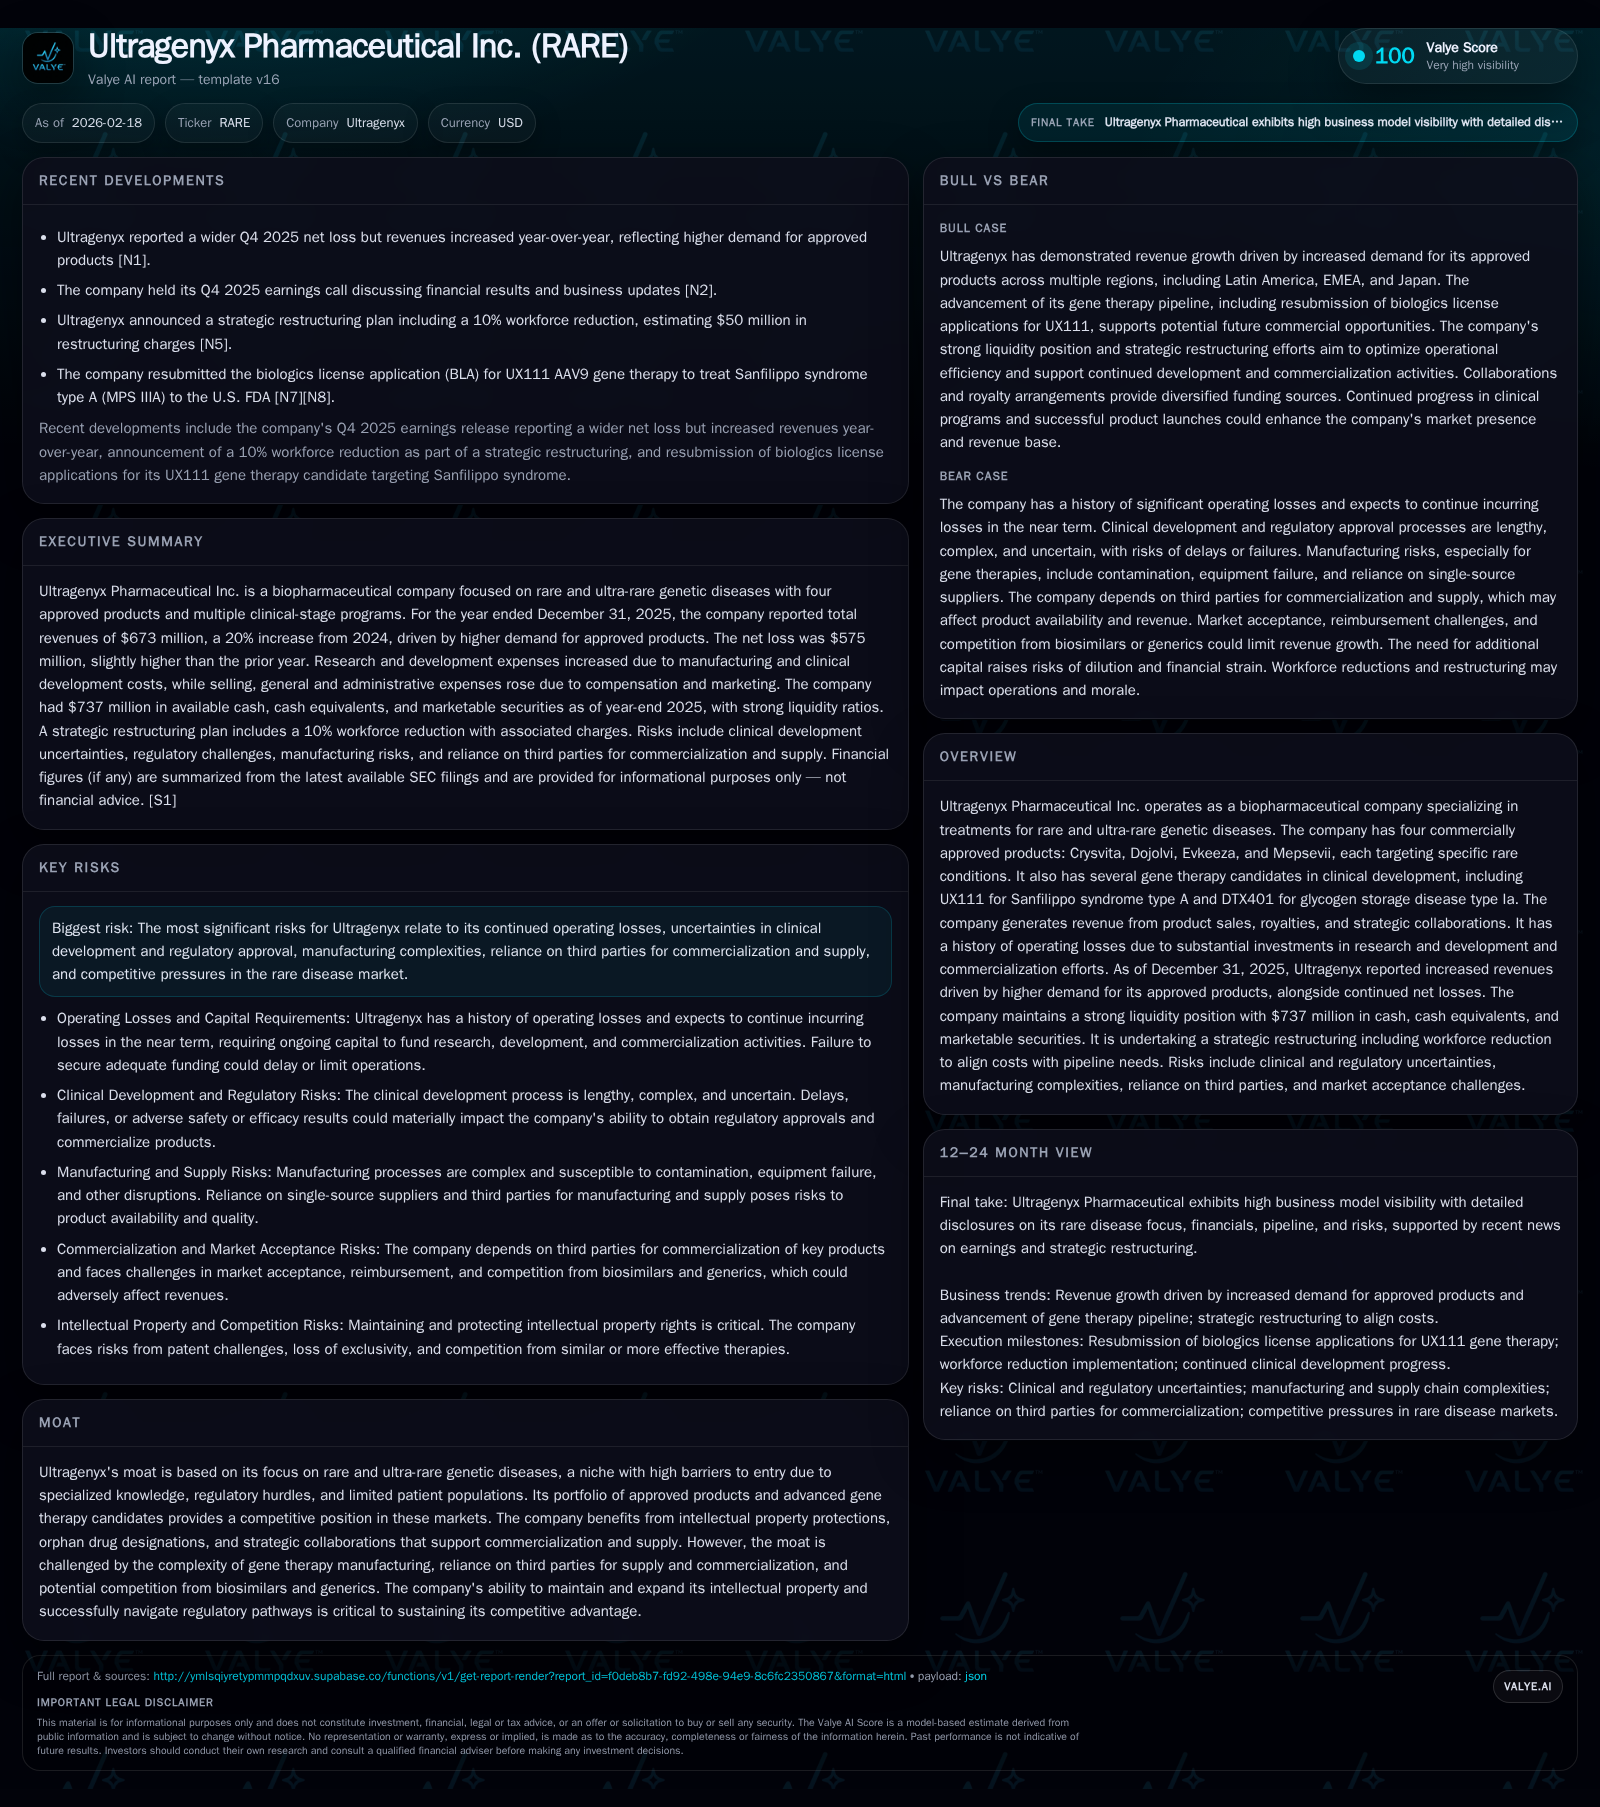
Ultragenyx Pharmaceutical Inc. (RARE) remains a focused player in the rare and ultra-rare genetic disease arena with four commercial products and a robust gene therapy pipeline. The company achieved revenue growth driven by increased demand for approved therapies but incurred a net loss of $575 million in 2025, reflecting continued heavy investment in R&D and commercialization. Key near-term catalysts include the resubmission of the BLA for UX111 for Sanfilippo syndrome type A, a milestone closely watched given previous regulatory setbacks. While Ultragenyx retains a strong liquidity buffer with $737 million in cash and equivalents, operating cash flows remain negative, underscoring ongoing capital needs and operational challenges in scaling gene therapy manufacturing and commercialization.
Company Overview and Market Focus
Ultragenyx Pharmaceutical Inc. is a biopharmaceutical company specializing in addressing rare and ultra-rare genetic diseases through both small molecule therapies and cutting-edge gene therapies. The company currently markets four approved products—Crysvita for X-linked hypophosphatemia, Dojolvi for long-chain fatty acid oxidation disorders, Evkeeza for homozygous familial hypercholesterolemia, and Mepsevii for a lysosomal storage disorder—all targeting niche patient populations where treatment options remain limited [S1].
Their strategy is anchored in deep scientific expertise, orphan drug designations securing market exclusivity periods, and efforts to develop transformative one-time gene therapies such as UX111 for Sanfilippo syndrome type A (MPS IIIA) and DTX401 for glycogen storage disease type Ia that could redefine standard-of-care profiles within these difficult-to-treat segments.
Historical Financial Performance
Ultragenyx's financial history is marked by substantial operating losses reflecting heavy investment into R&D pipelines and commercialization infrastructure in pursuit of long-term value creation. For the fiscal year ended December 31, 2025, total revenues rose markedly to approximately $673 million from $560 million a year earlier—an increase primarily driven by higher demand across its four marketed products [F1][S1].
However, despite this top-line advancement, the company’s bottom line remains under pressure. Net losses reached $575 million in 2025 against $569 million in the prior year, illustrating persistent spending requirements counterbalancing revenue gains. Operating income stayed deeply negative at -$535 million with little improvement year-over-year [F1]. This outcome reflects continued prioritization of pipeline progression coupled with commercial scaling costs.
Operating cash flow also remains negative at approximately -$466 million with free cash flow roughly tracking this level (-$472 million after subtracting capital expenditures). Capex declined sharply to about $6 million from over $7 million previously as major fixed asset investments have largely been completed, specifically around internal gene therapy manufacturing facilities [F1].
Historical performance (annual)
| FY | Net ($mm) | CFO ($mm) | OpInc ($mm) | Capex ($mm) | Net YoY |
|---|---|---|---|---|---|
| 2025 | -575 | -466 | -535 | 6 | -1.0% |
| 2024 | -569 | -414 | -536 | 7 | +6.2% |
| 2023 | -607 | -475 | -569 | 44 | +14.2% |
| 2022 | -707 | -380 | -649 | 116 |
Note: Omitted columns lack sufficient annual XBRL coverage in the provided tags (need ≥2 annual points): Rev, Div, Buybacks. Source: SEC companyfacts cache [F1].
Capital returns and efficiency (annual)
| FY | FCF ($mm) | ROE% |
|---|---|---|
| 2025 | -472 | 718.8 |
| 2024 | -422 | -222.9 |
| 2023 | -519 | -220.3 |
| 2022 | -497 | -200.7 |
Source: SEC companyfacts cache [F1].
Note: Revenue data not disclosed by line item or segment in XBRL tags; YoY revenue change based on reported narrative figures.
Return on equity cannot be reliably computed due to consecutive net losses turning equity negative by end-2025 (-$80 million), indicating accumulated deficits surpassing shareholder equity balances recorded at end-2024 (~$255 million); see table above [F1].
Commercial Portfolio Growth Drivers
Growth over recent years has stemmed mainly from expanded adoption of core products:
- Crysvita addresses phosphate metabolism disorders with expanding indications internationally via partner Kyowa Kirin Corporation (KKC).
- Dojolvi fills an unmet need in metabolic fatty acid oxidation disorder patients.
- Evkeeza targets patients with homozygous familial hypercholesterolemia.
- Mepsevii treats mucopolysaccharidosis VII.
Revenue gains reflect successful penetration into specialized specialist physician networks focused on rare diseases as well as improved reimbursement coverage facilitated through frequent payer engagement initiatives amid the complex reimbursement environment typical for orphan drugs [S1][S4].
Pipeline Advances and Regulatory Catalysts
Ultragenyx’s longer-term upside concentrates heavily on gene therapy candidates. Among these:
- UX111 (AAV9-based): Designed for Sanfilippo syndrome type A (MPS IIIA), an ultra-rare lysosomal storage disorder affecting cognitive function. The initial FDA submission was met with a complete response letter (CRL) citing manufacturing inspection observations related to their internal gene therapy facility and third-party supply chain partners [N7][N8][N9].[S1][S18]
- Resubmission of UX111's BLA occurred early 2026 aiming to address FDA concerns with enhanced data packages and manufacturing controls.
- DTX401 targets glycogen storage disease type Ia.
These gene therapy programs represent high scientific risk but potentially high reward due to the possibility of curative single-administration treatments. Their progress also places significant demands on specialized supply chains involving complex vector production processes where regulatory compliance remains challenging industry-wide .
Near-Term Financial Outlook & Operational Adjustments
Management’s commentary on the Q4/2025 earnings call highlighted that despite improving revenues driven by product sales gains, operating losses persisted largely unchanged due to sustained upfront expense loads supporting ongoing clinical trials, manufacturing scale-up activities and marketing infrastructure [N1].
Recognizing this dynamic, Ultragenyx implemented a workforce reduction of approximately 10% intended to better align cost structure with current development priorities following the regulatory setback around UX111’s initial submission [N6]. This suggests closer management control over burn rate amid capital preservation efforts.
No formal guidance is provided publicly beyond qualitative statements underscoring ongoing investments balanced against prudent expense management strategies [N11].
Capital Allocation & Liquidity Positioning
The company holds solid liquidity sufficient to fund its near-term clinical and commercial programs with approximately $737 million in total cash, cash equivalents and marketable securities as of December 31, 2025—a near doubling from around $374 million two years earlier coinciding with equity raises alongside product revenue increases [F1][S9][S23].
Capital expenditures dropped markedly as facility buildouts concluded from previous years’ heavy spending peaks ($116 million capex in FY22 down to just $6 million FY25), reflecting pivot from infrastructure investment towards operational focus areas like manufacturing process optimization rather than fixed asset expansion at this stage [F1][S15].
The company has not returned capital via dividends or share repurchases due to its growth-stage profile reliant on constant reinvestment into R&D pipelines; no public buyback programs are reported [F1].
Competitive Moat & Risks Assessment
Ultragenyx benefits from significant barriers typical in the rare disease space: narrow patient bases limiting direct competition; extensive regulatory protections such as orphan drug status; intellectual property portfolios safeguarding product formulations; plus strategic collaborations augmenting commercialization reach especially internationally (e.g., KKC partnership for Crysvita) [S1].
However, the complexity of gene therapy manufacturing introduces operational risks including reliance on third-party CMOs vulnerable to inspection setbacks or supply chain disruptions; regulatory enforcement actions can materialize unexpectedly imposing clinical delays or even withdrawals; competitive threats loom from biosimilars or innovative entrants pursuing alternative modalities; reimbursement pressures persist given high-cost specialty drug status; lastly political/regulatory environment unpredictability post-FDA CRL adds uncertainty around approval timelines [S4][S18][S24].
What To Watch Next: Key Milestones & Indicators
- FDA’s review outcome on resubmitted UX111 BLA – success could validate Ultragenyx’s platform approach transforming rare neurodegenerative diseases; failure would prompt reassessment of pipeline timelines.
- Commercial uptake trends for core approved drugs particularly Crysvita – sustained volume growth indicates durable market acceptance.
- Execution efficiency measured by quarterly operating expense trends post workforce cuts – any deviation upward may signal internal execution challenges.
- Cash burn trajectory relative to liquidity pool – approaching financing needs would trigger strategic funding considerations.
- Regulatory agency updates around manufacturing inspections affecting current marketed products or clinical trial continuity. These indicators collectively will frame trajectory clarity amid an inherently high-risk development environment characteristic of ultra-orphan pharma enterprises .
Disclaimer:
This analysis is solely informational based on publicly available data as of February 18, 2026. It does not constitute investment advice or recommendations regarding any securities. Prospective investors should conduct their own due diligence before making decisions regarding Ultragenyx Pharmaceutical Inc.
Disclaimer: This is research-only, informational analysis and not investment advice. It may include AI-generated interpretation and general industry context. Always verify important details using primary sources.
Comments