
AMN Healthcare’s Shrinking Operating Income and Strategic Shift in Workforce Solutions Under Debt Constraints
The company faces margin pressures and revenue declines yet pursues growth through technology-enabled staffing services amid high leverage.
AMN Healthcare Services Inc. experienced a notable contraction in operating income and net income in 2025 despite moderate revenue declines, driven by shifts in staffing demand and pricing pressures across segments. The company’s historic ramp-up supported by labor disruption events and diversified service lines now faces margin compression, particularly in nurse and allied solutions and physician leadership segments. With sizable long-term debt refinancings recently completed, AMN is focusing on scaling technology-driven workforce solutions and expanding its professional network to mitigate volatility risks. Monitoring upcoming quarters for margin recovery and successful digital adoption will be key, as capital allocation has shifted away from buybacks towards debt management.
Overview of AMN Healthcare
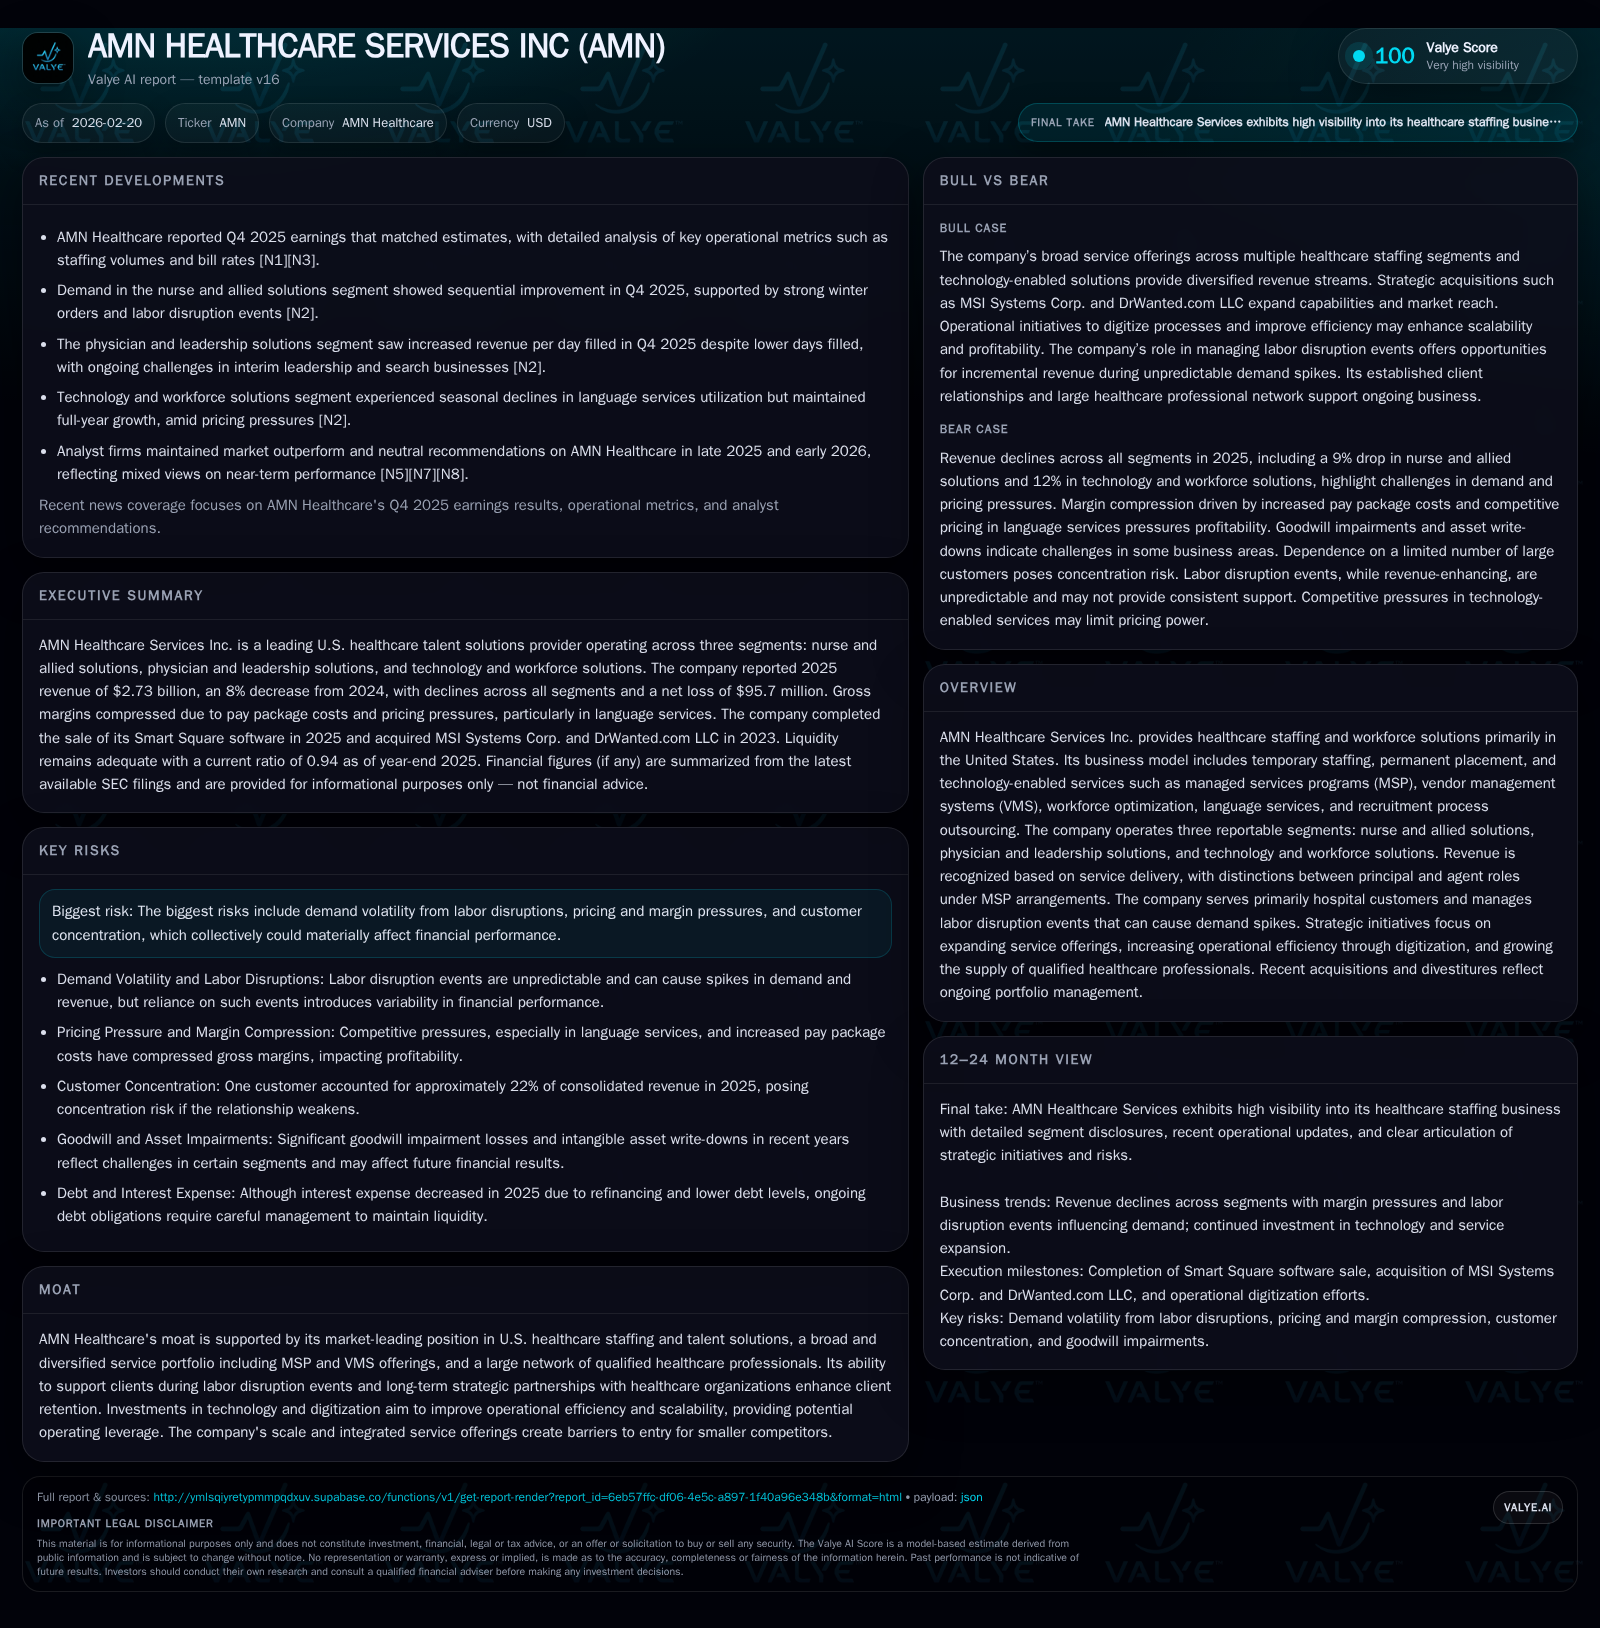
AMN Healthcare Services Inc., a prominent U.S.-centric provider of healthcare staffing and workforce solutions, operates through three core segments: nurse and allied solutions; physician and leadership solutions; and technology and workforce solutions [S1]. The firm extends beyond temporary staffing into permanent placement, managed services programs (MSP), vendor management systems (VMS), workforce optimization, language services, and recruitment process outsourcing — leveraging an increasingly tech-enabled model.
Historically, AMN has been recognized as a market leader due to its comprehensive service portfolio, extensive qualified professional network, and ability to navigate labor disruptions that often lead to sudden surges in demand [S1]. Strategic imperatives focus on expanding recurring revenue streams via technological investments while improving recruitment engagement.
Historical Financial Performance
Over the past four fiscal years leading up to 2025, AMN’s revenues have shown moderate growth followed by a contraction influenced by variable staffing demand dynamics (Table 1). Revenue peaked near $2.06 billion in 2024 before dipping approximately 5.2% to $1.96 billion in 2025 [F1]. The decline was primarily attributable to reductions across the nurse and allied solutions segment driven by a lower average number of travel nurses on assignment.
Operating income experienced pronounced volatility: after robust profits exceeding $647 million in 2022 owing notably to elevated staffing demand during COVID-era disruptions, the company swung back into negative territories with losses amounting to $103 million (2024) followed by a modest improvement to a $55 million loss reported for 2025 [F1]. Net income mirrored this trend — from gains above $444 million (2022) down to losses near $147 million in 2024 before narrowing losses to roughly $96 million for the latest fiscal year [F1].
Operating cash flows (CFO) similarly demonstrate contraction aligned with earnings pressure: CFO fell around 16% between 2024 ($320 million) and 2025 ($269 million), reflecting tighter working capital conditions even as the firm generated positive free cash flow around $234 million after capex of roughly $36 million [F1]. Capex levels have notably declined since peaking at over $100 million in earlier years — indicative of more cautious investment pacing.
Historical performance (annual)
| FY | Net ($mm) | CFO ($mm) | OpInc ($mm) | Capex ($mm) | Net YoY |
|---|---|---|---|---|---|
| 2025 | -96 | 269 | -55 | 36 | +34.9% |
| 2024 | -147 | 320 | -103 | 81 | -169.8% |
| 2023 | 211 | 372 | 338 | 104 | -52.6% |
| 2022 | 444 | 654 | 647 | 76 |
Note: Omitted columns lack sufficient annual XBRL coverage in the provided tags (need ≥2 annual points): Rev, Div. Source: SEC companyfacts cache [F1].
Capital returns and efficiency (annual)
| FY | Buybacks ($mm) | FCF ($mm) | ROE% |
|---|---|---|---|
| 2025 | 0 | 234 | -14.9 |
| 2024 | 0 | 240 | -20.8 |
| 2023 | 425 | 268 | 25.3 |
| 2022 | 577 | 578 | 42.5 |
Source: SEC companyfacts cache [F1].
Notes: Buybacks for years before FY24 shown when available; capex values rounded; dividends data not available from provided tags.
Segment Performance Highlights
The nurse and allied solutions segment remains AMN's largest business line but is currently under pressure due to declining traveler volumes which reduce provider pay package costs including housing/travel allowances — major components influencing gross margins [S28]. Revenue fell materially compared with the prior year.
Physician and leadership solutions saw mixed trends: interim leadership business declined whereas locum tenens experienced modest growth; overall profitability compressed.
Technology & workforce solutions reported slight revenue uptick primarily propelled by language services usage increases; however, the segment's overall gross margin contracted from about ~59% in prior periods to ~52.7% as price competition intensified following two major transitions — notably the divestiture of Smart Square scheduling software impacting higher-margin sales mix [S28].
Gross profit margins across all reportable segments reflected increasing compression caused partly by pay package pressures within clinical staffing operations alongside pricing challenges within language services [S28].
Capital Structure & Liquidity Profile
Following active capital markets engagement culminating in October 2025 with a new issuance of $400 million senior notes bearing a fixed coupon of 6.5% due in January 2031, AMN strategically redeemed all its outstanding $500 million notes coming due sooner [S6][S8][S13][S20]. Concurrently, the company's revolving credit facility capacity was downsized from $750 million down to $450 million with an extended maturity through October 2030 under amended covenant terms allowing maximum consolidated net leverage ratios sustained until at least March 31, 2027 [S6][S9].
As of December 31, 2025, total debt outstanding amounted approximately to $775 million including long-dated notes plus minimal revolver drawdowns [$25M] with compliance maintained across all covenants [S20]. These measures optimize interest expense outlays while providing balance sheet flexibility for ongoing operational needs or potential acquisitions.
AMN maintains adequate liquidity with combined cash plus undrawn revolver capacity well over several multiples of near-term liabilities although tight operating margins necessitate vigilant cash flow management particularly given industry payment cycles affecting days sales outstanding — which improved from about 70 days several years ago down near mid-40s recently attributed partly to improved collections discipline [S7][S16].
Capital Allocation: Returns & Shareholder Remuneration
Notably absent in recent fiscal years are share repurchases or dividend issuances; the company shelved all buyback activities starting post-2023 after historically significant repurchase total exceeding nearly $1 billion during preceding periods aimed at offsetting dilution and optimizing capital structure [F1][S4][S19]. This change corresponds with broad shifts toward fortifying liquidity amid margin contractions.
Return on equity was negative at approximately -14.9% for FY25 based on net losses relative to shareholders’ equity which stood at ~$642 million at fiscal year-end down from previous years owing partly to accumulated losses [F1]. This ROE downturn reflects mid-cycle financial repositioning rather than fundamental structural weakness.
Growth Drivers & Strategic Outlook
AMN pursues growth by expanding its technology-enabled MSP/VMS offerings integrated with workforce optimization tools—a strategic pivot intended toward more predictable recurring revenue sources less dependent solely on volume-driven temporary placements [S1]. Acquisitions such as MSI Systems Corp. and DrWanted.com augment these capabilities creating greater value-add differentiation via digital transformation initiatives aiming for operational scalability gains [S1].
Given historically episodic demand related chiefly to labor disruption events—unpredictable but often lucrative—AMN attempts smoothing seasonality impact by investing heavily in candidate recruitment technologies enhancing supply pipeline robustness that aids retention amidst competitive healthcare talent markets facing national shortages and regulatory complexities [S1][S15].
However, risks persist including customer concentration (with one customer representing roughly one-fifth of total revenues), ongoing pricing pressure eroding margins especially within language services facing increased commoditization, risk of fluctuating labor disruption frequency/timing creating volatility spikes impacting financial predictability; additionally macroeconomic factors could influence hiring budgets at hospital clients ultimately dampening volume growth potential [S15][F1].
What Investors Should Monitor Next
Absent explicit guidance disclosures for upcoming periods found within recent filings or news releases [N1][N3], market watchers should track:
- Sequential margin recovery trends driven by adoption pace of technology-enhanced MSP platforms;
- Utilization shifts among travel nurse assignments balanced against permanent placement growth;
- Operating cash flow stability amid receivables/payables management improvements;
- Degree of deleveraging or new acquisition-related capital deployment;
- Legal or regulatory developments particularly related to wage/hour litigations still potentially affecting cost structures;
- Competitive dynamics influencing language service price realizations impacting second half results.
Conclusion
AMN Healthcare Services Inc.’s financial trajectory over recent years presents a clear tension between historically strong operational leverage benefits during heightened demand episodes versus growing market headwinds compressing margins amid evolving industry structure favoring tech-enabled talent platforms. Its balance sheet conservatism following recent refinancing endeavors provides capacity but demands disciplined execution of strategic expansion efforts against cyclicality inherent in healthcare staffing markets.
Investment professionals following AMN should decipher how effectively AMN converts scale into sustainable profit improvement against a backdrop of elevated leverage costs while deepening integration of digital workforce management tools amidst intensifying competition within healthcare talent supply chains.
This analysis is based solely on publicly available data as of February 20, 2026. It does not constitute investment advice.
Disclaimer: This is research-only, informational analysis and not investment advice. It may include AI-generated interpretation and general industry context. Always verify important details using primary sources.
Comments