
Restaurant Brands International Balances Brand Strength and Leverage Constraints
RSTRF leverages a portfolio of strong quick-service brands while navigating financial leverage and liquidity limits.
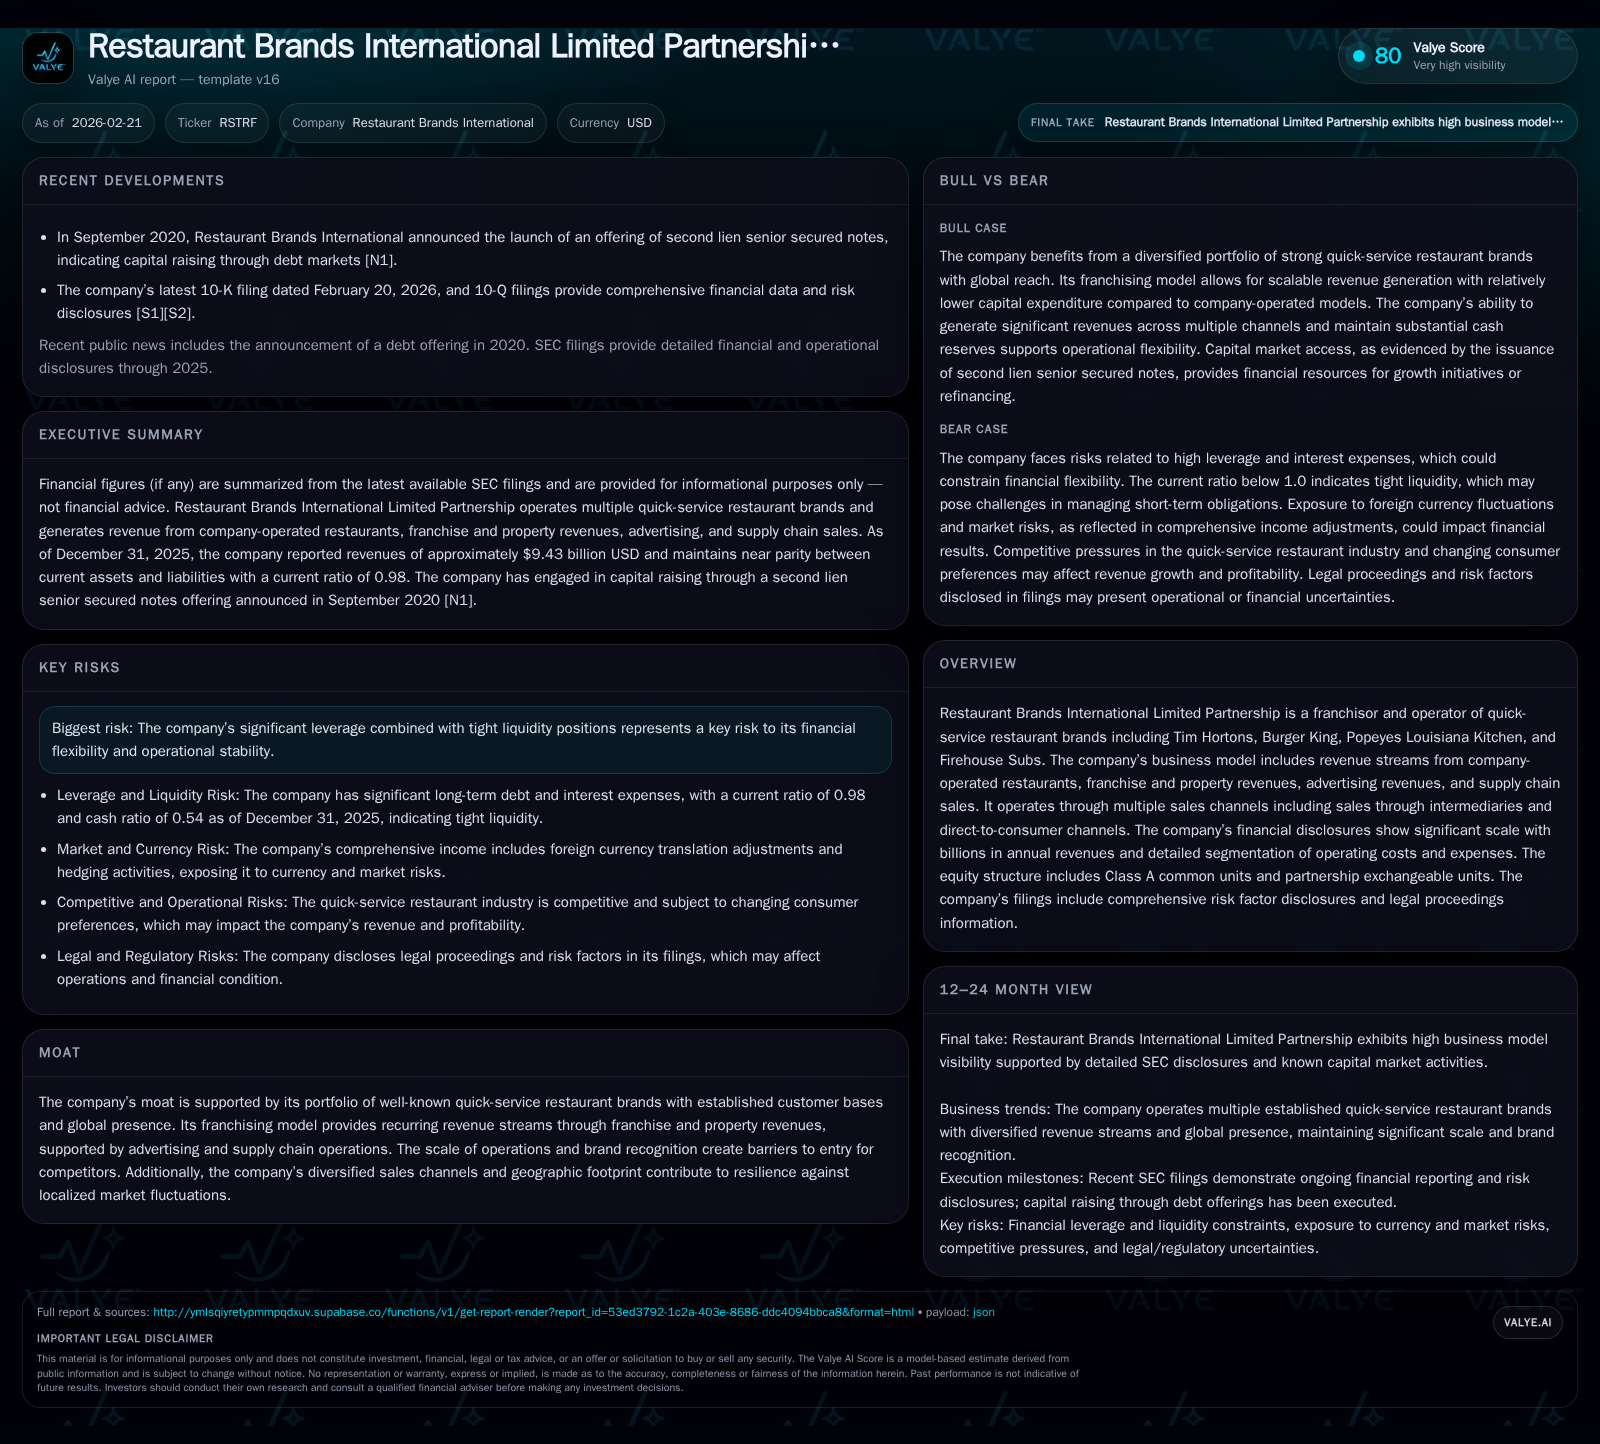
Restaurant Brands International Limited Partnership (RSTRF) operates globally recognized franchise brands including Tim Hortons, Burger King, Popeyes, and Firehouse Subs. The company has demonstrated consistent revenue growth driven by its franchising model and diversified sales channels but faces pressure from significant leverage that may constrain financial flexibility. Operating income showed a recent decline despite top-line growth, and capital allocation heavily favors dividends over share repurchases. Monitoring debt dynamics and free cash flow generation will be key to assessing future operational stability.
Overview and Business Model
Restaurant Brands International Limited Partnership (RSTRF) is a major player in the quick-service restaurant (QSR) sector, franchising iconic brands including Tim Hortons, Burger King, Popeyes Louisiana Kitchen, and Firehouse Subs . Its business model integrates multiple revenue streams: company-operated restaurant sales, franchise royalties and property revenues, advertising revenues through cooperative advertising programs with franchisees, and supply chain product sales. Sales occur via intermediaries (franchisees) and direct-to-consumer channels leveraging digital ordering platforms.
RSTRF’s scale is evident in its billions of dollars of annual revenues and detailed segmentation of operating costs outlined in recent SEC filings [S1][S2]. The equity structure comprises Class A common units and partnership exchangeable units reflecting complex ownership layering.
Historical Financial Performance
The company has realized significant revenue growth over recent years largely fueled by expanding its franchised restaurant base across global markets. From approximately $6.5 billion reported revenue for fiscal year (FY) 2022 it expanded to $9.4 billion in FY 2025 — a compound annual growth rate (CAGR) near 18% — underscoring momentum across its brand portfolio [F1]. This top-line increase reflects positive same-store sales growth at core brands alongside unit expansion.
However, operating income tells a nuanced story: RSTRF’s operating income peaked around $2.42 billion in FY2024 but contracted by roughly 9% to about $2.20 billion in FY2025 despite higher revenues [F1]. This suggests margin pressures potentially stemming from rising labor costs, commodity inflation impacting food inputs (a frequent challenge faced by QSR chains), or increased investment in marketing and technology platforms.
Reported net income available up to FY2020 shows volatility with a pronounced decline by FY2020 ($139 million), compared to healthier earlier periods ($578 million in FY2017) [F1]. More recent comprehensive net income figures are not fully disclosed within the tagged data but point to ongoing earnings volatility possibly impacted by financial expenses related to heavy leverage.
Operating cash flow (CFO) trends upwards, growing about 14% year-over-year for FY2025 to approximately $1.71 billion. This robust cash flow supports reinvestment (capital expenditures climbed to $265 million from $201 million prior year) as well as sizable dividend payments totaling over $1.1 billion for the year [F1]. Notably, there have been no material share buybacks recently reported.
The following table summarizes key annual financial metrics:
Historical performance (annual)
| FY | Rev ($bn) | CFO ($mm) | OpInc ($bn) | Capex ($mm) | Rev YoY |
|---|---|---|---|---|---|
| 2025 | 9.4 | 1714 | 2.2 | 265 | +12.2% |
| 2024 | 8.4 | 1503 | 2.4 | 201 | +19.7% |
| 2023 | 7.0 | 1323 | 2.1 | 120 | +7.9% |
| 2022 | 6.5 | 1490 | 1.9 | 100 |
Note: Omitted columns lack sufficient annual XBRL coverage in the provided tags (need ≥2 annual points): Net, Buybacks, ROE%. Source: SEC companyfacts cache [F1].
Capital returns and efficiency (annual)
| FY | Div ($mm) | FCF ($mm) |
|---|---|---|
| 2025 | 1108 | 1449 |
| 2024 | 1029 | 1302 |
| 2023 | 990 | 1203 |
| 2022 | 971 | 1390 |
Source: SEC companyfacts cache [F1].
*Note: Net income data post-2020 unavailable; dividends reflect payments made.
Capital Structure and Liquidity
RSTRF’s balance sheet reveals a leveraged profile with total liabilities exceeding $20 billion as of late-2025 filings [S23][S25], among which long-term debt outstanding stands near $13.4 billion net of discount/premiums and current maturities [S23][S25]. Current assets hover slightly below current liabilities giving a current ratio close to but under one (~0.98), signaling tight near-term liquidity positioning [F1].
The company utilizes multiple tranche notes with varying coupon rates typically between approximately mid-4% to mid-6%, combined with credit facilities evidenced by revolving lines-of-credit disclosed across quarterly updates [S7][S8][S12][S13][S14][S17]. Hedging instruments such as interest rate swaps and foreign currency contracts appear deployed to manage financial risk exposures tied to cross-border operations [S5][S7].
While cash balances remain healthy at just over $1 billion cash and equivalents end-2025-Q3 period, substantial debt amortization schedules will require ongoing strong free cash flow performance to maintain financial flexibility.
Business Moat and Strategic Positioning
RSTRF’s competitive advantage springs predominantly from its collection of globally renowned quick-service concepts — an asset class that delivers inherent consumer loyalty combined with scalable franchising margins . The extensive global footprint diversifies geographic risk exposures enabling resilience against localized economic or competitive disruptions.
Additionally, recurring revenue streams from franchise royalty fees tied directly as a percentage of sales provide steady cash inflows leaner on capital intensity compared with wholly company-operated models seen among some peers.
The company also benefits from integrated advertising models that coordinate national brand campaigns funded partly by franchisee contributions along with centralized supply chain sales supporting brand quality standards at scale.
Risks and Constraints
Despite strengths, RSTRF faces notable risks centered around its elevated leverage—both absolute debt levels and resultant interest obligations consume considerable earnings capacity creating vulnerabilities during macroeconomic or industry-specific downturns [S4][S9]. Tight liquidity ratios intensify these constraints potentially hindering tactical capital deployment or necessitating refinancing at unfavorable terms.
Operational risks include exposure to fluctuating commodity prices impacting food costs—a persistent headwind for QSR operators—as well as labor market challenges elevating wage expense burdens.
Legal proceedings disclosures indicate ongoing litigation risks customary for large multi-jurisdictional businesses but lack specifics precluding deeper impact assessment at this time [S4]. Regulatory scrutiny remains an area requiring watchfulness given shifting health standards, advertising regulations especially for youth-targeted marketing, and data privacy norms relevant for digital channels.
Outlook: Growth Drivers and Milestones to Watch
Looking ahead, RSTRF’s growth opportunities center on expanding the franchise network globally particularly leveraging emerging markets where Western QSR penetration remains relatively nascent compared with mature North American segments. Digital channel innovation including app-based ordering integration is anticipated to further bolster direct-to-consumer sales enhancing overall ticket sizes while improving customer experience.
Operational efficiency gains could be pursued through supply chain optimizations and technology investments aimed at streamlining kitchen operations and reducing food waste—areas that significantly influence unit economics in the QSR sector.
No explicit formal guidance or forecast milestones were noted within the latest filings or press releases relative to this report date; however monitoring quarterly same-store sales trends alongside operating margin evolution will provide critical indicators of whether margin contraction seen in FY2025 reverses.
Capital allocation seems weighted towards sustaining attractive dividend yields appealing to income-focused investors though absence of buyback programs reflects possible prioritization toward deleveraging initiatives or preserving liquidity buffers.[S16]
Returns Profile and Capital Allocation Insights
Approximate return on equity as derived from latest available net income over equity hovers around a modest low single-digit figure (~3.8%), reflecting significant capital structure leverage diluting profitability.[F1] Cash flows remain strong however enabling robust dividend coverage with distributions above one billion dollars annually complemented by meaningful reinvestment shown via capex increases supporting asset base refreshment or expansion activities.
No material share repurchases have occurred recently diminishing potential EVA-enhancing effects through capital structure adjustments common among peer companies focusing on shareholder return maximization.[F1][S16]
Conclusion
Restaurant Brands International Limited Partnership presents a compelling combination of global brand power bolstered by multi-channel franchising revenues offset against challenges arising from elevated leverage levels that constrain operational flexibility amid evolving restaurant industry dynamics.
Its future trajectory will hinge heavily on balancing reinvestment into brand development and technological enhancements against prudent financial management aimed at managing debt maturities while safeguarding liquidity cushions against cyclical risks inherent in consumer discretionary spending patterns.
Investors should closely monitor governance cues on capital allocation strategy shifts, margin trend reversals following recent compression episodes, same-store sales momentum across core geography clusters, as well as macroeconomic factors influencing commodity input cost volatility driving cost structures.
Disclaimer: This analysis is based exclusively on information obtained from public filings and does not constitute investment advice or recommendations regarding any securities mentioned herein.
Disclaimer: This is research-only, informational analysis and not investment advice. It may include AI-generated interpretation and general industry context. Always verify important details using primary sources.
Comments