
ROCKY BRANDS Emerges Stronger with Multi-Channel Growth and Tariff Mitigation
Robust FY2025 financial rebound reflects strategic retail expansion, product innovation, and proactive tariff responses.
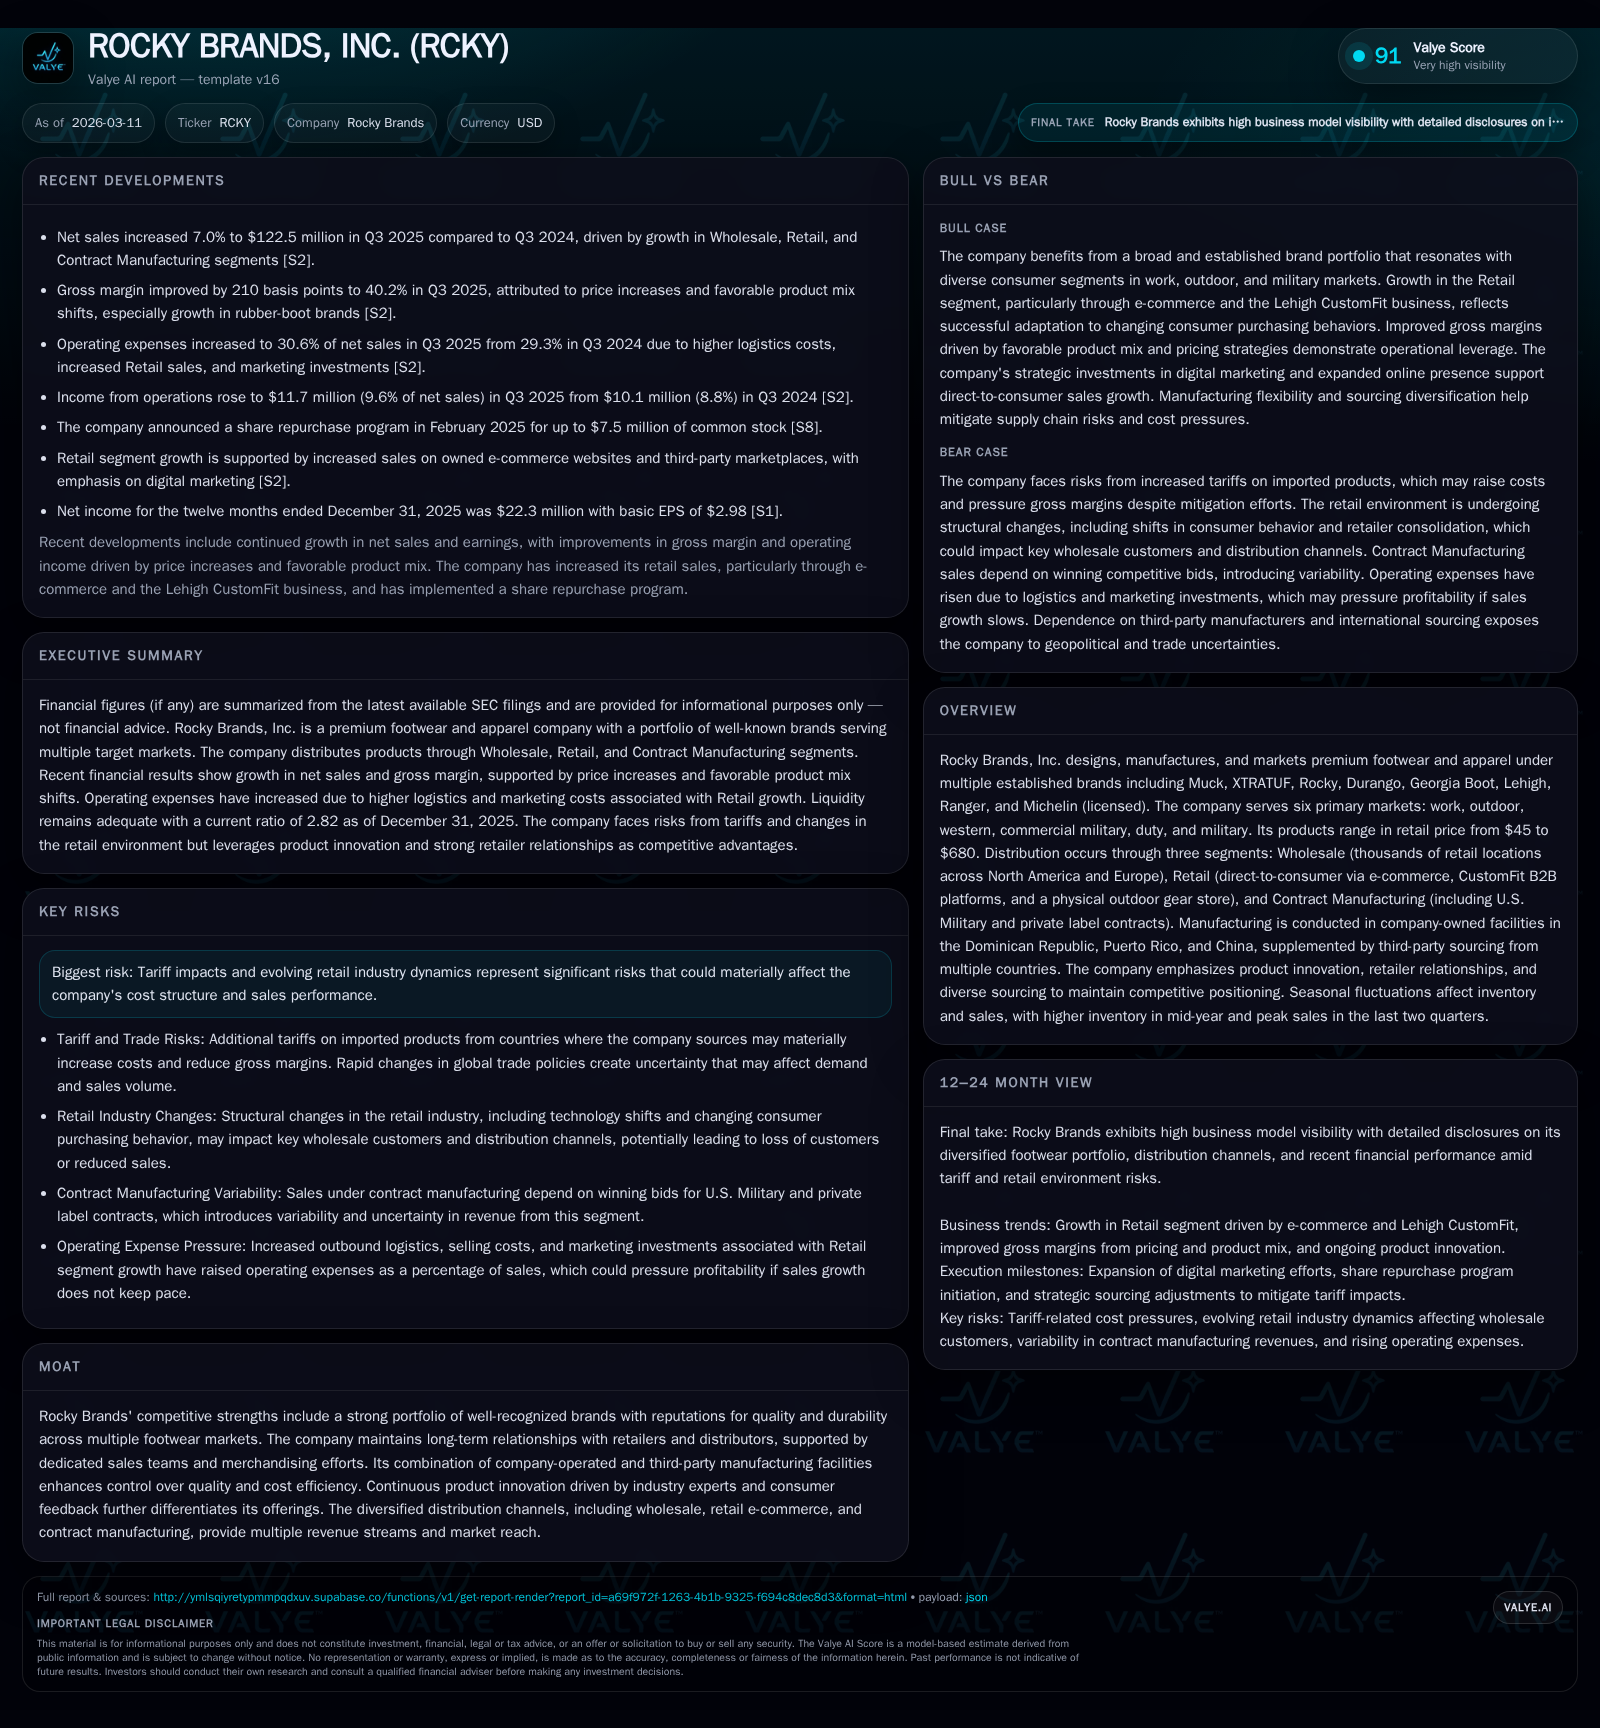
Rocky Brands delivered a notable turnaround in FY2025 with double-digit revenue growth and nearly doubled net income, driven by growth across Wholesale, Retail, and Contract Manufacturing segments. The company's multi-channel emphasis—especially surging Retail sales supported by e-commerce and B2B platforms—coupled with tariff mitigation strategies through expanded company-owned manufacturing, underpinned margin improvements despite cost headwinds. While cash flow generation softened considerably due to inventory build and tariff-related costs, disciplined capital allocation sustained dividend payouts with modest buybacks. Key monitoring areas include the effectiveness of ongoing tariff adjustments, retail channel profitability, and product innovation trajectories.
Historical Financial Performance: Growth Patterns and Margin Drivers
Rocky Brands exhibited a strong financial recovery through FY2025 with revenue reaching approximately $371.9 million, marking a 12.1 percent increase compared to the prior year [F1]. Operating income grew by an even more impressive 19.7 percent year-over-year to $37.2 million [F1], highlighting effective margin leverage. Net income nearly doubled to $22.3 million for the year [F1], driven primarily by gross margin expansion fueled by favorable shifts in product mix toward premium rubber boot brands including Muck and XTRATUF [S2].
Seasonality remains significant; as most footwear products cater to adverse weather conditions, inventory levels peak in Q2–Q3 while sales intensify in the latter half of the year [S1]. The diversified portfolio spanning work, outdoor, western, commercial military, duty, and military markets enabled stable top-line momentum across segments. The gross margin improvement also reflects proactive pricing actions taken in late 2025 that compensated partially for tariff-driven cost increases [S2].
Historical performance (annual)
| FY | Net ($mm) | CFO ($mm) | OpInc ($mm) | Capex ($mm) | Net YoY |
|---|---|---|---|---|---|
| 2025 | 22 | 16 | 37 | 7 | +95.6% |
| 2024 | 11 | 53 | 31 | 5 | +9.2% |
| 2023 | 10 | 74 | 35 | 4 | -49.1% |
| 2022 | 20 | 19 | 44 | 7 |
Source: SEC companyfacts cache [F1].
Capital returns and efficiency (annual)
| FY | Div ($mm) | Buybacks ($) | FCF ($mm) |
|---|---|---|---|
| 2025 | 5 | 201000 | 10 |
| 2024 | 5 | 48 | |
| 2023 | 5 | 70 | |
| 2022 | 5 | 0 | 12 |
Source: SEC companyfacts cache [F1].
Operating cash flow dropped substantially in FY2025 (-69 percent YoY) attributed largely to increased inventory purchases as the company sought to pre-position merchandise before tariffs took effect [F1], [S13]. Meanwhile, capital expenditures rose by about 41 percent reflecting investments aimed at manufacturing capacity enhancements and preparatory moves for distribution center expansion in Ohio [F1], [S5].
Evolving Distribution Dynamics: Retail’s Rising Share
The Retail segment has registered faster growth relative to Wholesale and Contract Manufacturing over recent periods [S1], [S2]. This shift stems from targeted digital marketing initiatives and expanded direct-to-consumer penetration through both proprietary e-commerce websites and third-party marketplaces [S9], complementing ongoing development of the Lehigh CustomFit business-to-business platform which offers tailored safety footwear solutions directly to corporate clients [S21].
Despite its higher growth rate, this channel exhibits higher selling expense ratios driven by customer acquisition costs inherent in e-commerce operations and channel unit economics marked by promotional activity during parts of the year [S2], [S24]. Yet, Retail also delivered improved gross margins primarily due to wholesale price increases adopted in Q3–Q4 of FY2025 that offset earlier margin pressures attributable to elevated promotional discounts [S19]. Incremental digital marketing spend has been instrumental in widening customer reach but contributes to elevated operating expenses as a percentage of sales within this segment [S2].
Wholesale continues to serve thousands of brick-and-mortar retailers across North America and Europe including major customers such as Amazon, Boot Barn, Tractor Supply Company, and Bass Pro Shops with broad market coverage spanning specialized channels such as uniform stores and outdoor retailers [S9], [S16]. Contract Manufacturing maintains steady contribution with military contracts comprising a key part but operates at lower margin levels given scale sensitivities particularly noticeable at the Puerto Rico facility [S12].
Tariff Challenges and Supply Chain Adaptations
A critical risk materialized during FY2025 when new U.S.-imposed tariffs affected major sourcing countries including China and Vietnam where Rocky Brands sources a significant portion of its products [S2], [S28], [S29]. To mitigate these costs’ impact on gross margin profile and pricing competitiveness, Rocky expanded utilization of company-owned manufacturing facilities notably in Puerto Rico and the Dominican Republic where tariff exposure is reduced or absent due to U.S. territories’ favorable trade status [S2].
Increased inventory levels reflect tactical pre-purchases ahead of tariff enactment dates representing inventory valuation inflation alongside hedging against supply chain disruptions [S13], [F1]. The company also engaged supplier renegotiations combined with judicious price increases passed selectively to consumers to maintain profitability without sacrificing demand elasticity excessively [S28]. Nonetheless, ongoing geopolitical uncertainties keep import-dependent manufacturers like Rocky vulnerable to fluctuating trade policies, potential retaliatory tariffs by foreign governments, currency volatility, labor unrest risks at foreign plants, and transportation cost spikes especially involving ocean freight lanes servicing Asia-Caribbean routes.
Product Innovation and Brand Portfolio Strategy
Rocky Brands leverages its multipronged brand architecture spanning Muck to Durango across six distinct markets: work, outdoor, western, duty, commercial military, and military sectors—a foundational element enabling cross-selling opportunities among similar customer bases held by retailers [S9], [S20]. The diverse pricing spectrum from entry-level $45 footwear up to $680 premium models allows penetration across value-conscious buyers through enthusiasts demanding technical features such as waterproofing or advanced foot support coupled with durability expectations [S1].
Investment in continuous product innovation led by recognized footwear experts fosters differentiation through technology integration aligned with evolving consumer comfort preferences—an approach essential for sustaining brand equity amid increasing competition from established international footwear providers as well as large retailer-owned private label lines potentially encroaching on Rocky’s shelf space [S20], [S18].
Market acceptance risks are managed through phased product rollouts while relying heavily on retailer partnerships enhancing merchandising displays which amplify brand presence physically alongside robust e-commerce storytelling capabilities via customized digital content explaining technical benefits directly addressing end-user needs [S20], [S16]. Complementary apparel expansions broaden total consumer wallet share with offerings aligned stylistically but distinct enough not to dilute core footwear brand identities.
Balance Sheet Strength, Capital Allocation, and Shareholder Returns
Liquidity remains sound with a strong current ratio of approximately 2.82 at FY-end 2025 supported by $270 million in current assets against $96 million current liabilities primarily composed of working capital accounts receivable and inventory balances swollen due to tariff hedging activities [F1]. Total debt was about $122 million net of issuance costs representing modest deleveraging versus prior periods aided by credit facility restructuring completed in April 2024 that replaced prior term loan facilities reducing interest expense burdens significantly alongside declining interest rates environment contributing to lower finance charges this past year ($8–$17 million range over recent years inclusive of one-time extinguishment fees) [S1], [S4], [S5], [S7], [S11].
Cash flow generation faced headwinds owing to increased working capital consumption particularly inventory build (+$14 million FY-end), constraining free cash flow after capital reinvestment which rose about forty-one percent ($6.6 million capex) mainly directed at plant equipment upgrades plus land acquisition for proposed distribution center expansion layout near Ohio headquarters consistent with efforts described since mid-2025 filings[F1], [S23]. Return on equity measured roughly at eight point eight percent based on net income relative to average equity balance [$22 million / $252 million] reflects improving underlying business economics despite temporary working capital tie-ups.[F1]
Dividend distributions remained essentially stable near $4.6 million per annum reflecting deliberate steady shareholder returns while share repurchase activity was minimal ($201 thousand FY2025)—reflective perhaps of cautious capital deployment preference given near-term external uncertainties but maintaining flexibility for opportunistic buyback programs should excess liquidity become available or valuation considerations arise.[F1]
Forward-Looking Considerations: What to Watch for Rocky Brands
Looking ahead for Rocky Brands involves close attention on several operational vectors without conjecture: assess whether tariff mitigation measures via internal manufacturing capacity scaling continue effectively reducing per-unit landed cost impacts; monitor Retail segment’s evolving profitability amid ongoing elevated marketing expenses focused on digital channels along with retention/growth rates within the Lehigh CustomFit B2B platform; watch new product launch reception carefully given historical unpredictability around development schedules combined with competitive pressures evident across each target market segment; track operating expense trends especially outbound logistics that have contributed upward pressure on margins previously; note upcoming debt maturity profiles as refinancing options or repayment commitments could influence financial flexibility; be mindful of potential macroeconomic shocks triggered by global trade policy volatility including further tariffs or retaliatory actions which remain intrinsic risks revealed repeatedly in disclosures; finally observe quarterly margin sustainability metrics linked especially to inventory turnover considering seasonal fluctuations prominent in this industry.
Maintaining retailer engagement strength remains crucial given retail industry structural shifts such as footprint contraction among physical store bases plus oversaturation risks from private brands developed by some wholesale customers themselves which could encroach upon branded product shelf space reducing purchase volumes materially if not strategically managed.[S18]
Disclaimer: This analysis is intended solely for informative purposes regarding Rocky Brands’ operational performance trends and industry context utilizing available data up to early March 2026 without expressing investment advice or specific recommendations.
Disclaimer: This is research-only, informational analysis and not investment advice. It may include AI-generated interpretation and general industry context. Always verify important details using primary sources.
Comments