
Regency Centers Corp: Navigating Retail REIT Leadership Amid Macroeconomic Shifts and Strategic Growth
An in-depth analysis of Regency Centers’ expanded retail portfolio, lease income growth, and capital strategies amid ongoing sector challenges.
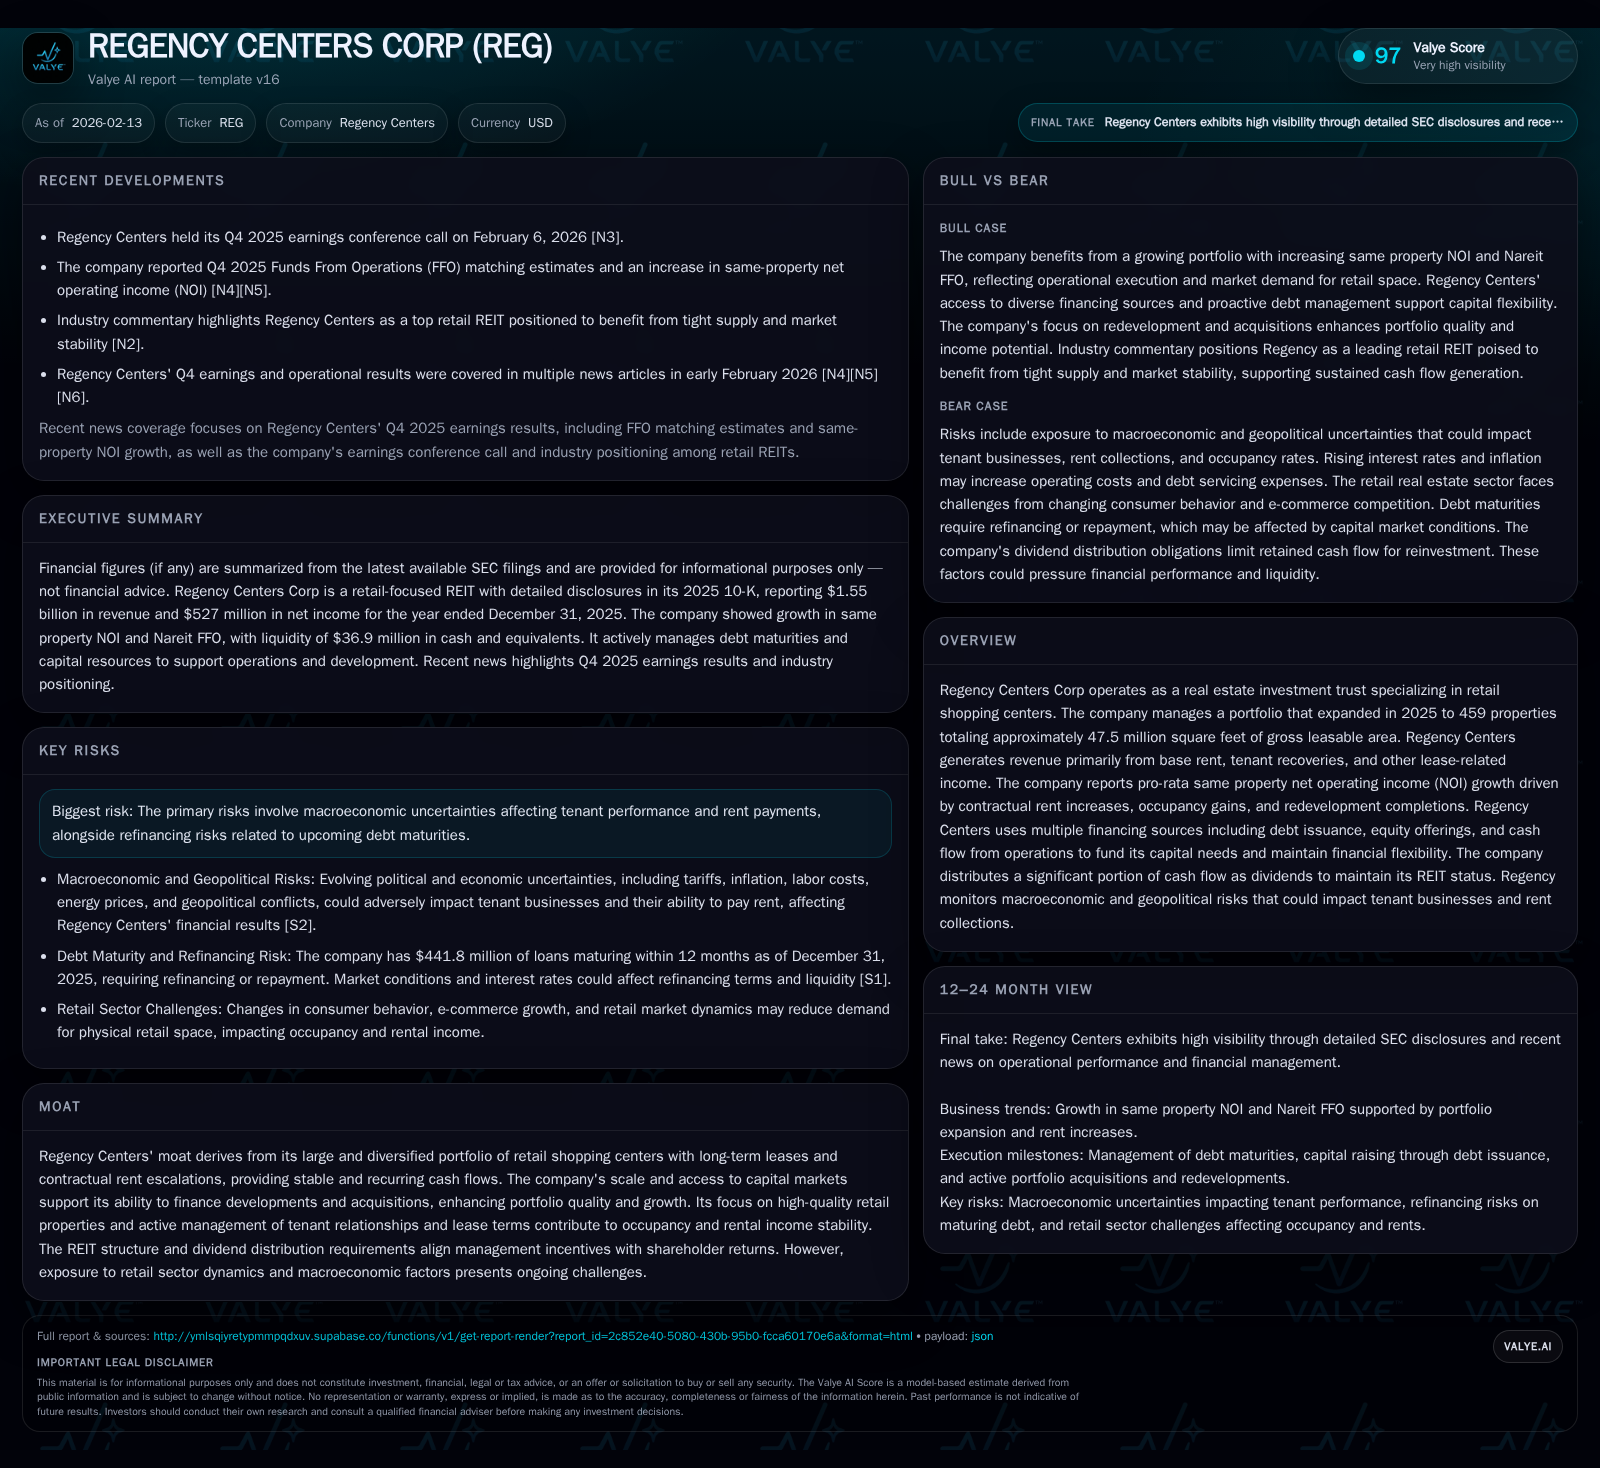
Regency Centers Corp solidified its position as a leading retail REIT with portfolio expansion to 481 properties totaling over 58 million square feet by end-2025. Lease income gains stemmed from occupancy improvements, contractual escalations, redevelopments, and strategic acquisitions, balancing a rising expense base. The company’s moat is anchored in scale, high-quality tenant relationships, and disciplined capital deployment. While Regency enjoys competitive positioning among retail REIT peers, it faces notable macroeconomic headwinds including geopolitical tensions and inflationary pressures that temper outlooks. Management’s prudent capital strategy and redevelopment pipeline aim to sustain NOI growth amid refinancing risks and evolving industry dynamics.
Anchoring Success: Regency’s Retail Footprint and Portfolio Expansion in 2025
Regency Centers Corp completed a pivotal year in 2025 marked by significant expansion of its retail footprint that underscores its stature as a national leader in grocery-anchored community shopping centers. The company increased its total holdings to 481 properties with approximately 58.4 million square feet of gross leasable area (GLA) on an ownership basis. When factoring Regency's pro-rata interest inclusive of unconsolidated partnerships, the portfolio’s GLA totals roughly 50.5 million square feet — nearly a half-billion square feet under management across primarily suburban trade areas boasting robust demographic profiles [S1][F1].
This growth reflects the culmination of strategic acquisitions including consolidations of previously partial interests into full ownership positions as well as selective developments transitioning to stabilized operational status during the year. The portfolio predominantly features high-quality grocery anchors complemented by necessity-based service providers and convenience retailers that create highly trafficked community hubs.
The 2025 portfolio enhancements have not only expanded physical scale but elevated the revenue base underpinning future cash flows. Herein lies the foundation supporting Regency’s thematic emphasis on creating thriving environments connecting retailers with their neighborhoods — a vision aligned with sustainable local economic ecosystems.
Lease Income Growth Drivers: Unpacking Base Rent, Tenant Recoveries, and Contractual Rents
Lease income grew impressively by $100 million in 2025 compared to the prior year, an outcome propelled primarily by higher base rents that accounted for nearly $63 million of this increase [S1]. This jump reflected multi-faceted contributors:
- Occupancy improvements coupled with contractual rent escalations embedded in long-term lease agreements delivered approximately $25.7 million.
- Redevelopment projects that progressed to operational status contributed an additional $14 million through fresh rent commencements.
- Acquisitions effectuated during the year added around $16.2 million via immediate income accretion from existing tenants.
- Full consolidation of some partnership-held assets brought incremental rent contributions upwards of $5.5 million.
Tenant recoveries—a critical component representing pass-through of operating expenses such as maintenance and real estate taxes—rose by over $31 million reflecting both higher occupancy rates driving cost allocations and increased underlying expense levels [S1]. This aspect highlights an important operational lever where Regency aligns costs borne with tenants to protect net margins.
Other lease-related income including termination fees saw a modest uptick but remained minor relative contributors compared with core base rents and recoveries.
Overall, the leasing engine demonstrates effective execution of rent roll optimization through active lease management combined with accretive additions from redevelopment completions and acquisitions.
The Operational Engine: Expense Trends and Capital Deployment Decisions
Alongside revenue growth came a commensurate rise in operating expenses totaling an incremental $30.4 million in 2025 versus 2024 [S1]. This increase was principally driven by:
- Property operating expenses up $16.2 million attributed mainly to cost inflations in common-area maintenance utilities and management services amplified by greater occupancy.
- Real estate taxes rose nearly $7.9 million influenced by both portfolio expansion effects and higher tax rates in selective jurisdictions.
- Depreciation and amortization costs increased around $10.3 million reflecting capitalization of recent acquisitions as well as completion of development projects entering depreciable life.
Notably, general & administrative costs experienced a slight reduction — indicative of ongoing efforts toward administrative efficiency even amid expanding operations.
This expense dynamic reveals Regency's ongoing balancing act between investing capital to enhance asset quality via redevelopments while maintaining disciplined control where possible over fixed overheads. Judicious capital deployment remains pivotal given the competing demands from development pipelines against sustaining dividend payouts required under REIT structures.
Decoding the Moat: Scale, Lease Structures, and Tenant Relationships
Regency’s moat is entrenched in its scale advantage—managing one of the largest portfolios among retail-focused REITs—and its commitment to long-term leases incorporating periodic contractual rent escalations providing revenue predictability [valye_report_excerpt][S1].
The tenant mix heavily favors essential retailers such as market-leading grocers whose defensive business models cushion against e-commerce displacement risks affecting discretionary retail segments. By focusing on necessity-oriented anchors within suburban communities exhibiting favorable demographics—the company buttresses occupancy stability even as broader economic conditions fluctuate.
Active asset management plays another crucial role; Regency adjusts lease terms thoughtfully while fostering durable tenant relationships that often enable positive rental spreads upon renewal or turnover events. These elements collectively modulate volatility inherent to retail real estate.
Furthermore, Regency’s REIT status mandates significant cash flow distribution aligning management incentives closely with shareholder returns — embedding governance discipline supportive of prudent financial stewardship.
Market Positioning within Retail REIT Peers and Competitive Dynamics
Relative to peers such as Simon Property Group (SPG), Kimco Realty (KIM), Federal Realty (FRT), among others, Regency holds competitive standing exhibiting steady same-property NOI growth alongside improving occupancy metrics [N6][N7][N10][N12][N13]. Its focused niche on grocery-anchored suburban centers distinguishes it within an industry grappling with mixed results driven in part by urban mall declines or experiential retail disruptions.
While Simon Property reported Q4 outperformance fueled by diversified malls plus outlet centers [N10], Kimco also improved occupancy amid tactical leasing success stories [N6], Federal Realty faced slight misses yet maintained positive guidance backed by redevelopment pipelines [N5]. Against this backdrop Regency’s performance appears resilient albeit not immune from sector-wide headwinds including rising cost pressures for maintenance/utilities mentioned earlier.
In essence, Regency leverages portfolio quality along with conservative underwriting practices which offer differentiation amidst intensifying competition for prime retail real estate assets nationally.
Navigating Macro Risks: Geopolitical, Economic, and Sector-Specific Headwinds
A prominent theme threading through Regency’s disclosures is careful acknowledgment of macroeconomic uncertainties that interplay profoundly with retail real estate fundamentals [S2]. Key risks include:
- Inflationary pressures increasing operational costs placing upward pressure on recoverable expenses for tenants.
- Tariffs coupled with trade disputes creating volatility impacting supply chains which could impair tenant inventory availability or input costs.
- Labor market tightening compounded by immigration policy flux potentially elevating wage demands for retail employees impacting store economics negatively.
- Geopolitical conflicts such as those involving Russia/Ukraine or tensions in the Middle East generating broader economic unease suppressing consumer confidence.
- Federal Reserve monetary policy shifts influencing borrowing costs critical for both Regency’s financing activities as well as tenant credit strength perception.
Given Regency’s core concentration in suburban settings anchored by essential services rather than luxury or discretionary formats some risk mitigation exists inherently through tenant selection though no model remains impervious under sustained adverse macro conditions.
Capital Strategy: Balancing Debt, Equity Financing and Dividend Policies
Financing expansion amidst growing portfolio scale has seen Regency deploy a calibrated mix of capital sources comprising debt issuance balanced against opportunistic equity raises supplemented by steady operating cash flow generation [valye_report_excerpt][S1]. This strategy maintains flexibility essential for funding development projects while preserving investment-grade credit metrics — critical given looming debt maturities cited as potential refinancing risk factor.
Dividend distribution remains central not solely as shareholder return but also necessitated by REIT tax code compliance fostering capital discipline within management ranks [valye_report_excerpt]. Careful monitoring ensures capex commitments do not jeopardize payout sustainability thereby protecting market reputation among income-focused investors.
Overall Regency appears proactive harnessing financial markets access enabling selective growth yet conscious about maintaining conservative leverage thresholds prudent amidst evolving interest rate landscape.
Forward Vision: Management’s Outlook Amid Uncertainties and Opportunities
Recent communications from management underscore cautious optimism regarding near-term same-property NOI growth prospects driven largely by redevelopment project completions activating incremental rent streams alongside continued leasing momentum at renewed or re-leased spaces [N1][S2].
However they simultaneously flag external economic uncertainties demanding vigilance particularly relating to inflation trends, consumer spending shifts post-pandemic normalization phases, plus potential headwinds from geopolitical instability disrupting overall U.S. economic environment impacting retail tenancy fundamentals.
Adjustments to leasing strategies or capital allocation priorities may be implemented where warranted but the overarching posture remains one of measured confidence founded on asset quality fundamentals reinforced throughout prior years’ disciplined expansion efforts.
Investment Implications: Valuation Considerations and Key Risk Factors
For buy-side observers parsing valuation support levels versus embedded risk exposures at Regency Centers it becomes imperative to weigh stable recurring cash flows emanating from long-term leased grocery-anchored assets against dynamic macroeconomic conditions challenging rent collection durability presently punctuated by refinancing timing risks cited repeatedly within disclosures [valye_report_excerpt][S2][F1].
Growth visibility is anchored significantly on successful execution within redevelopment pipelines complemented by continued tenant retention ability while concurrently navigating cost inflation pressures effectively—these serve as critical benchmarks moving forward.
Risk-return profiles remain nuanced; hence capital market participants will likely scrutinize updates around tenant health metrics alongside debt maturity refinancings closely for signs either affirming resilience or signaling emerging vulnerabilities within the complex retail real estate landscape reshaped significantly over recent years.
This analysis incorporates quantitative data sourced directly from SEC filings dated February 13th, 2026 (Form 10-K) alongside recent market commentary reported in early February 2026. It offers an informed perspective blending factual reporting with contextual interpretation without constituting investment advice.
Disclaimer: This is research-only, informational analysis and not investment advice. It may include AI-generated interpretation and general industry context. Always verify important details using primary sources.
Comments