
Reynolds Consumer Products Executes Robust Q1 Results Backed by Category Dominance
Q1 2026 performance highlights reaffirm Reynolds' leadership in household consumer staples through sustained innovation and strong retail partnerships.
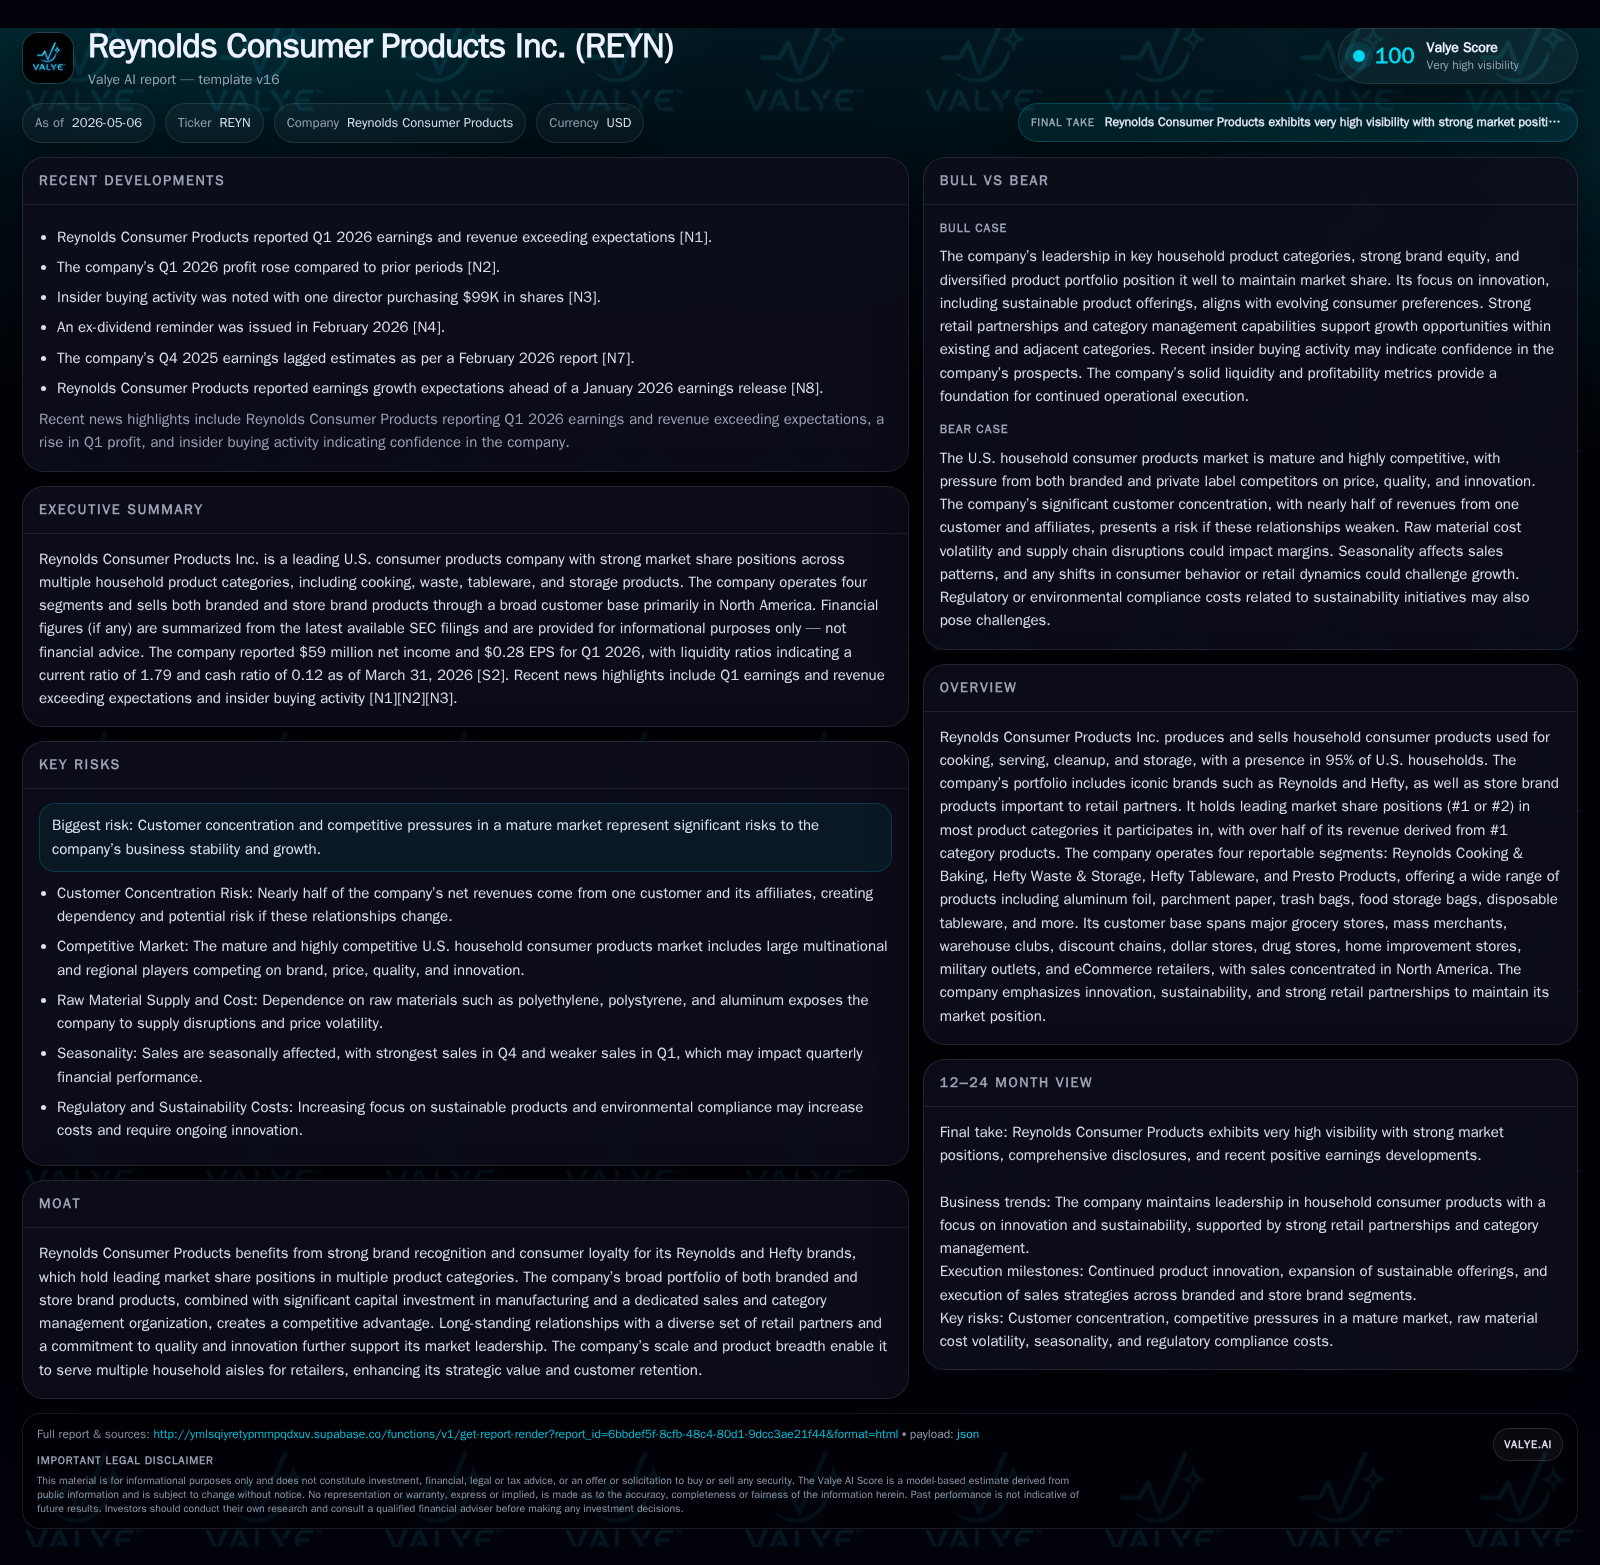
In Q1 2026, Reynolds Consumer Products Inc. delivered results that exceeded consensus estimates, underscoring its entrenched market position across cooking, storage, and waste management product categories. The company's broad portfolio comprising iconic Reynolds and Hefty brands, supported by a mix of branded and store brand products, continues to drive category growth within a mature industry. While customer concentration and raw material cost volatility remain watchpoints, strategic innovation pipeline investments and scale advantages underpin Reynolds’ ability to maintain competitive share in a complex retail landscape.
Latest Quarterly Performance and Why It Matters
Reynolds Consumer Products' Q1 2026 financial results released in its May 6th filings [S2], [S3] showcased its ability to outperform earnings and revenue consensus forecasts [N1]. The quarter maintained steady volumes across its four key segments amid a typical seasonal trough but was bolstered by higher-than-anticipated trade promotion efficiency and favorable mix improvements particularly within premium branded lines of Reynolds Cooking & Baking and Hefty Waste & Storage. This continuation of robust operating execution amidst prevailing macro uncertainty validates the company's deep-rooted consumer household penetration—present in roughly 95% of U.S. homes—and reinforces its dominant positions in mostly #1 or #2 product categories by volume and dollars.
In particular, management highlighted continued strength in sales velocity through mass merchant and warehouse club channels as well as accelerated adoption within discount/dollar store formats where private label competition traditionally intensifies [S2]. Such channel dynamics paired with Reynolds’ innovation cadence for adjacent-use products underpin positive category momentum that challenged conventional cyclicality expectations.
Business Model and Product Portfolio Analysis
Reynolds generates revenue principally through sales of both iconic branded products (e.g., Reynolds Wrap foil, Hefty trash bags) and complementary store brand offerings sold to major retailers under multi-year or annual contracts [S1], [S9]. The business is segmented into Reynolds Cooking & Baking (aluminum foil, baking papers), Hefty Waste & Storage (trash bags, food storage), Hefty Tableware (disposable plates/cups), and Presto Products (primarily store brand food storage/trash bags) [S24].
The company's revenue mechanics rest on volume-driven unit sales combined with pricing strategies calibrated to mix shifts between premium branded versus store brand lines. Margins reflect not only manufacturing cost efficiencies stemming from high capital plant utilization but also the impact of trade promotions—accounting for about 5% of total net revenues as reductions to reported sales—which require careful accrual estimation and reconciliation given program variability [S1].
Reynolds' vertically integrated production capabilities grant essential control over quality — paramount for consumer loyalty — while facilitating innovation launches that expand into new household use occasions such as slow cooker liners or compostable tableware segments. Their blended channel approach taps grocery stores, mass merchants, warehouse clubs, dollar stores, drug stores, home improvement outlets, military sellers, plus growing eCommerce presence to deliver extensive distribution reach [S9],.
Competitive Position and Industry Dynamics
Operating within mature yet consolidated consumer staples categories, Reynolds holds top-two market shares in most jurisdictions it competes in; brand strength fortified by near-universal recognition (98% awareness for Reynolds brand) underpins its moat, [S15]. Its blend of branded products alongside store brand contracts positions it favorably within retailers' category management strategies focused on overall category growth rather than just share shifting.
However, the business contends with concentrated customer exposure: three customers accounted for approximately 59% of net revenues in fiscal year 2025—Customer A alone representing nearly half—never-the-less foster sustained partnerships critical to shelf-space allocation and joint innovation efforts [S11], [S25]. Pricing power faces constant pressure from private labels which intensify competition on price points especially in value-tier channels.
Supply chain resilience matters significantly given material inputs like polyethylene resin for plastics and aluminum for foil products dominate raw costs. Centralized sourcing with multi-year agreements supports steady supply but market-driven cost volatility necessitates nimble procurement strategies [S15]. Regulatory compliance surrounding food-contact uses plus emerging environmental claims regulation inject operational complexity which Reynolds manages via dedicated corporate governance structures.
Growth Catalysts Shaping Future Demand
Key growth drivers evidenced in Q1 filings include:
- Innovation Pipeline: Focused launches expanding product adjacencies (e.g., compostable tableware under the Hefty brand), improving relevance among environmentally conscious consumers.
- Channel Expansion: Enhanced footprint within dollar stores/discount chains complements established dominance in grocery/mass merchant segments; digital commerce acceleration also noted as incremental albeit smaller mix contributor currently.
- Trade Promotion Optimization: Improving visibility into program returns assists fine-tuning incentive spend to maximize volume uplift while protecting margins.
- Category Penetration: Strong synergies created via serving multiple household aisles enable cross-selling opportunities enhancing retailer collaboration efficacy [S2], [N2],.
Such drivers appear structurally anchored since consumption patterns around convenience-oriented household goods remain consistent across demographics. Yet Reynolds balances aggressive investment against mature category elasticity.
Risks, Challenges, and Strategic Headwinds
Several constraints pose ongoing risk:
- Customer Concentration: Dependency on a small set of large retail partners elevates negotiation leverage risk; shifts in procurement priorities or private label expansion could materially affect volumes.
- Raw Material Cost Volatility: Price fluctuations in polyethylene resin and aluminum expose margins unless offset by pricing agility or cost reduction programs.
- Competitive Intensity: Escalating private label penetration creates persistent pricing pressure compelling continuous innovation investment.
- Regulatory Complexity: Evolving legislation concerning food safety standards and environmental marketing claims demands vigilant compliance processes impacting operational overheads.
- Leverage Profile: As of March 31, 2026, net debt stands near $1.46 billion against cash reserves of $71 million with a current ratio of 1.79 indicating reasonable liquidity but necessitating prudent debt management given cyclical earnings swings [F1].
Management’s historical focus on trade promotion accrual accuracy illustrates sensitivity around revenue recognition impacting perceived financial results integrity [S1].
Upcoming Indicators to Monitor
Attention should focus on:
- Q2 earnings guidance updates reflecting early demand signals post-Q1 promotional activities.
- Commercialization progress of new product introductions especially adjacent-use innovations supported by consumer feedback loops.
- Retail partner reviews tied to category growth performance metrics including share gains against private labels.
- Trade promotion spend-to-return dynamics evolution as data granularity improves.
- Capital allocation decisions balancing investment in manufacturing scale expansion versus deleveraging objectives following recent refinancing actions [S2], [N1], [N2].
Tracking these factors will clarify sustainability of recent outperformance trends amid sector headwinds.
Current Financial Position and Metrics
Latest financial snapshot
| Metric | Value | Period |
|---|---|---|
| Cash & equivalents | $71mm | |
| 2026-03-31 | ||
| Total debt | $1530mm | |
| 2026-03-31 | ||
| Net debt | $1459mm | |
| 2026-03-31 | ||
| Current assets | $1105mm | |
| 2026-03-31 | ||
| Current liabilities | $616mm | |
| 2026-03-31 | ||
| Current ratio | 1.79x | |
| 2026-03-31 |
Source: SEC companyfacts cache [F1].
| Metric | Value (USD) | Date |
|---|---|---|
| Cash & Equivalents | 71,000,000 | |
| 2026-03-31 | ||
| Total Debt | 1,530,000,000 | |
| 2026-03-31 | ||
| Net Debt | 1,459,000,000 | |
| 2026-03-31 | ||
| Current Assets | 1,105,000,000 | |
| 2026-03-31 | ||
| Current Liabilities | 616,000,000 | |
| 2026-03-31 | ||
| Current Ratio | 1.79 | |
| 2026-03-31 |
This snapshot reflects a solid liquidity position enabling ongoing operational flexibility even amid debt levels typical for the sector's capital-intensive nature. Operating cash flows historically cover interest expenses with capacity for maintenance capex consistent with long-lived asset structure supporting manufacturing footprint [F1], [S12], [S17]. Profitability remains robust but under natural pressure from input costs balanced by trade promotion calibration.
This analysis synthesizes public SEC filings alongside industry context without offering investment advice. All financial figures are drawn strictly from disclosed documents as cited. Market dynamics evolve rapidly; readers should consider additional sources when forming any commercial views regarding Reynolds Consumer Products Inc.
Disclaimer: This is research-only, informational analysis and not investment advice. It may include AI-generated interpretation and general industry context. Always verify important details using primary sources.
Comments