
SAIC Enhances Defense Sector Profitability Amid Strategic Reorganization and SilverEdge Acquisition
SAIC's latest quarter shows improved margins driven by acquisition integration and operational efficiencies within a simplified organizational structure.
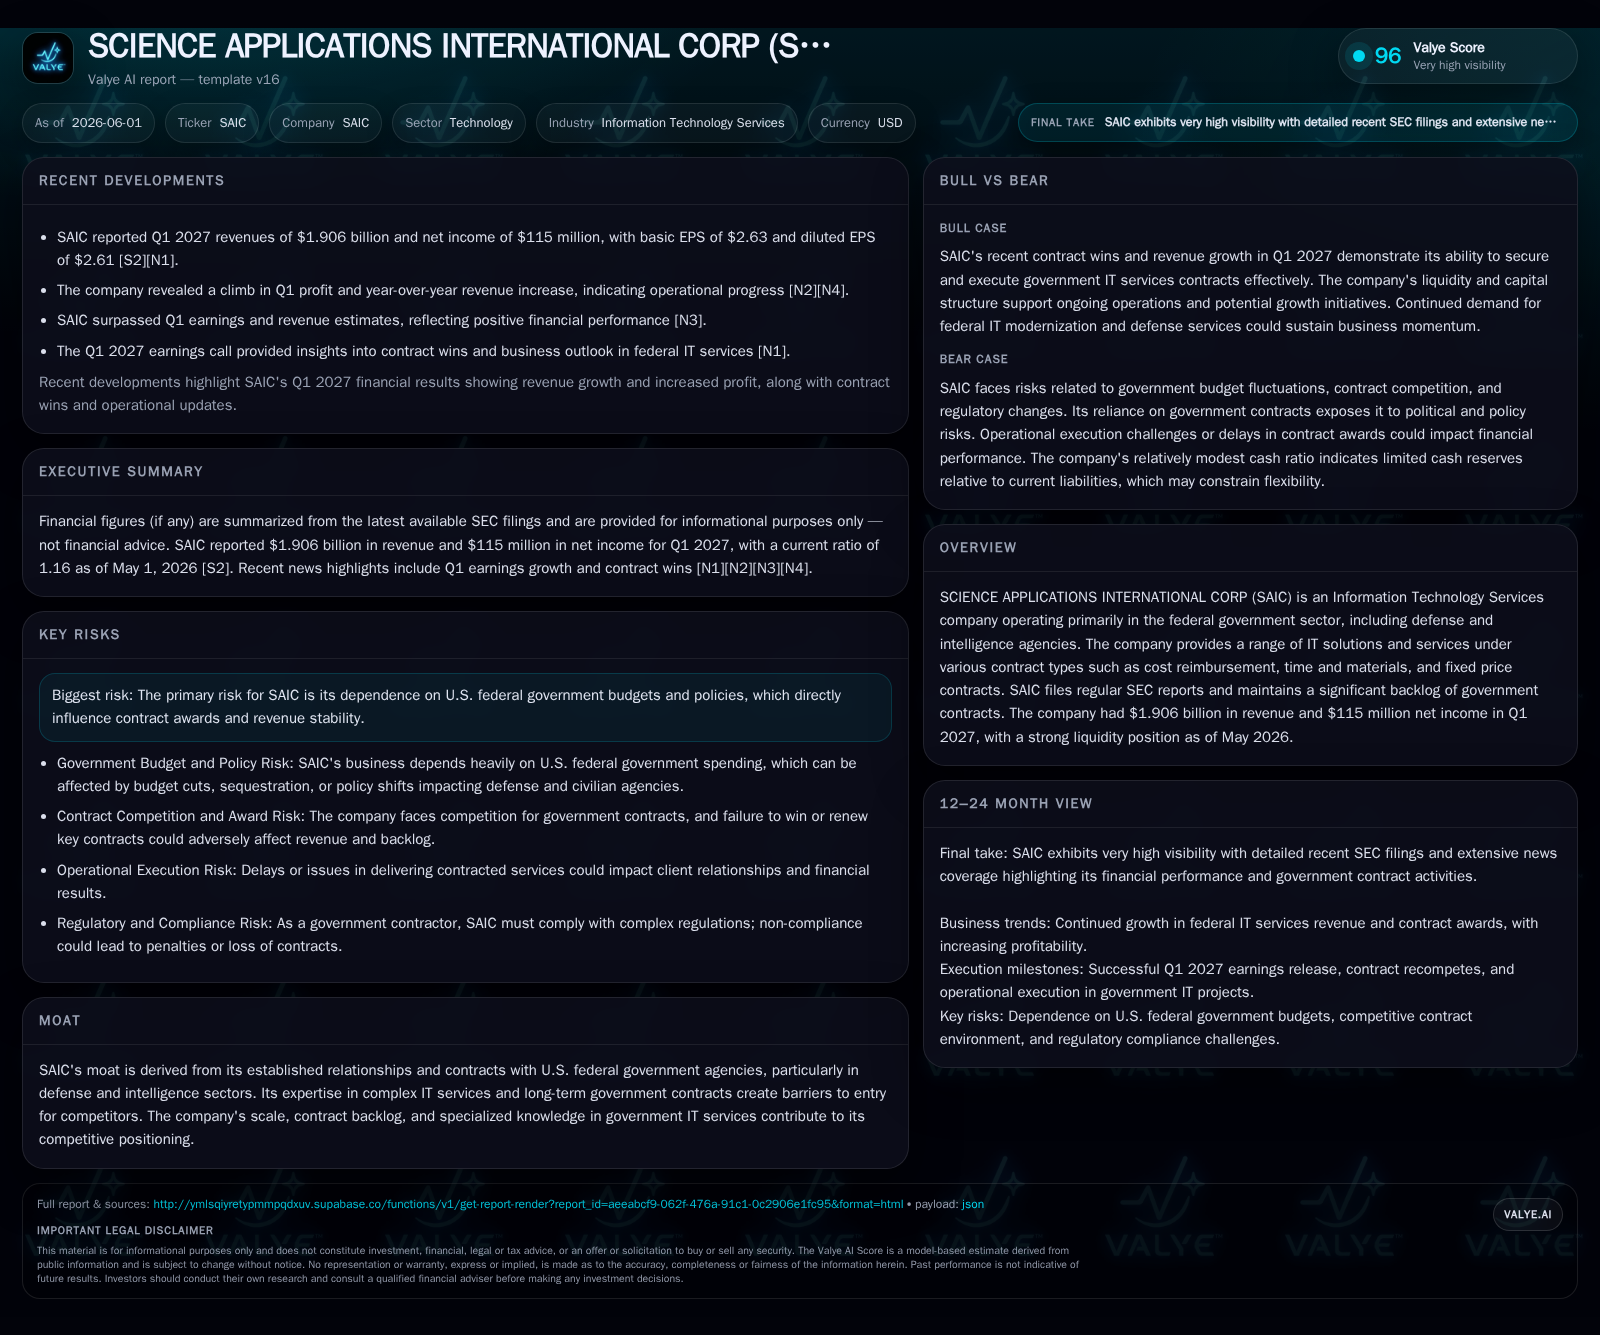
Science Applications International Corporation (SAIC) reported modest revenue growth to $1.906 billion in Q1 fiscal 2027, fueled by the acquisition of SilverEdge Government Solutions and increases in contract volumes. The company’s reorganization into three streamlined business groups aims to sharpen customer focus while maintaining its core segments serving U.S. defense and intelligence agencies. Operating income surged 48% year-over-year to $179 million, reflecting enhanced contract profitability and a gain on investment sales. SAIC's competitive moat remains anchored in longstanding federal contracts, technical expertise, and scale; however, dependence on government spending cycles poses ongoing risks. Growth is supported by digital transformation initiatives and emerging technology integration across mission-critical federal programs.
Recent Operating Update
In its Q1 fiscal 2027 quarterly filing dated June 1, 2026 [S2], SCIENCE APPLICATIONS INTERNATIONAL CORP (SAIC) reported revenues of $1.906 billion—a modest 2% increase from the same period last year—driven primarily by the recent acquisition of SilverEdge Government Solutions, which contributed $19 million in incremental revenues. Revenue growth was further supported by volume ramps on existing contracts alongside new wins, although partially offset by the natural completion of some contracts.
Operating income showed a robust improvement, rising 48% year-over-year to $179 million with a margin expansion from 6.4% to 9.4%. Adjusted operating income—which excludes depreciation, amortization, acquisition-related costs, and other non-recurring expenses—increased even more significantly to $221 million or an 11.6% margin versus just 8.4% in the prior year quarter [S12]. The uplift was attributed to improved profitability across the portfolio as the company leverages operational efficiencies and pricing discipline. A notable one-time gain of $12 million from an investment sale also aided this result [S7].
The company completed a reorganization as of January 31, 2026 that consolidated five prior business groups into three streamlined customer-facing business groups led by executive vice presidents reporting directly to the CEO [S16]. This structural simplification aims to enhance customer focus and operational agility while retaining its two established reportable segments for financial disclosures: Defense and Intelligence, and Civilian [S15].
Business Model
SAIC operates as a leading technology integrator primarily serving U.S. federal government customers including defense departments and intelligence agencies [S9]. The company’s revenue generation relies heavily on a vast portfolio exceeding approximately 1,700 active contracts encompassing a diverse mix of contract vehicles: cost reimbursement, time-and-materials (T&M), and firm fixed price (FFP) [S20]. Approximately 97% of revenues are sourced from U.S. government contracts directly or via subcontracts [S16].
Revenue mechanics depend on delivering services ranging from full life cycle system development—including design, integration, deployment—to operation, sustainment, and cybersecurity support for mission critical platforms that modernize national security infrastructure [S2][S15]. Pricing power stems largely from SAIC’s specialized technical expertise deployed against complex federal mandates where alternative providers face significant barriers due to incumbent relationships and compliance rigor.
Margins benefit when revenue includes a higher proportion of SAIC’s direct labor rather than subcontractors or variable cost materials—a performance metric closely managed by internal program managers who continuously assess contract risks/opportunities [S6]. The Solutions and Technology Group enhances differentiation by developing enterprise-class digital transformation tools based on AI, cloud automation, network services, application development, engineering, and cybersecurity capabilities; these offerings can be combined stand-alone or integrated into broader contract scopes across segments [S2][S15].
Industry Structure and Competitive Position
As one of the largest pure-play technology services companies focused exclusively on federal markets, SAIC holds a competitive moat grounded in long-standing relationships with agencies such as the Department of War (DoW) —formerly Department of Defense—and the Intelligence Community [S20]. Its diverse contract base spreads exposure across land, sea, air and space defense missions enabling resilience against cyclical spend shifts.
Peers consist largely of other government IT contractors such as Leidos Holdings Inc., CACI International Inc., Booz Allen Hamilton Holdings Corp., which compete for similar contracts but may differ in scale or portfolio focus. SAIC's organizational scale with approximately 23,000 employees provides substantial delivery capacity for large multi-year engagements [S9]. In addition to scale advantage, SAIC emphasizes competitive pricing through strategic sourcing efforts alongside development of repeatable “as-a-service” offerings aimed at improving cost structure sustainability amid evolving Federal procurement trends [S6].
Growth Drivers
The primary growth catalysts are tied to expanding digital transformation adoption within defense and civilian federal agencies seeking modernization of IT infrastructure under secure conditions. Emerging technology integrations—AI-enabled analytics, cloud migration support, next-gen cybersecurity frameworks—are core demand drivers as agencies prioritize resilient digital environments supporting national imperatives [S2][S15].
Expansion is further enabled by incremental contract wins that build on existing backlogs estimated at significant levels providing multi-year visibility [S9]. Recent acquisitions like SilverEdge broaden technical capabilities especially in cyber defense sectors complementing organic growth.
Government funding remains a key upstream input; SAIC benefits when appropriations stabilize or grow under defense budgets supporting intelligence modernization initiatives [S16]. The recent resolution of Department of Homeland Security funding uncertainties removes short-term headwinds with Congress extending appropriations through FY2026 end.
Risks and Watchpoints
A dominant risk factor is SAIC's dependence on U.S. federal government budgets which are susceptible to political dynamics including executive branch priorities or Congressional appropriations processes that can cause volatility in contract awards or funding flow [S19][S16]. Prolonged government shutdowns or freezes may delay revenue recognition or impede new program starts.
Additionally at legal risk is an ongoing DOJ criminal antitrust investigation following grand jury subpoenas issued since April 2022; management is cooperating fully but potential liabilities remain uncertain [S8][S19]. Any adverse findings could impact reputation or financial position.
Operationally, execution risks include managing workforce allocation efficiently across a large labor pool to maintain margins amid fluctuating contract volumes—especially given mix sensitivity caused by subcontractor usage versus direct labor costs [S6]. Lastly technological disruptions require continuous innovation investments lest competitors erode the company's leadership in secure IT services.
What to Watch Next
Key milestones include the cadence of contract awards especially within Defense & Intelligence where sustained ramps underpin near-term revenue; observers should monitor backlog replenishment metrics provided in subsequent filings along with renewal announcements.
Integration progress post-SilverEdge acquisition will affect synergy realization timelines impacting margins going forward. Updates from ongoing DOJ investigations remain an important legal watchpoint.
Management commentary around adapting pricing models toward more commercial-as-a-service models will offer clues about margin sustainability amid changing procurement trends.
Finally liquidity management amidst ~$2.5 billion debt load balanced against moderate cash reserves ($109 million) deserves monitoring—though current ratio indicates adequate short-term coverage—with attention paid to any refinancings or covenant discussions highlighted in future SEC filings or earnings calls [F1][S2][S27]
Financial Profile Briefly
At quarter-end May 1, 2026 SAIC held cash & equivalents totaling $109 million against total debt approximating $2.5 billion implying net debt near $2.39 billion with a current ratio at ~1.16 reflecting modest working capital cushioning [$F1][S2]. Effective tax rate stood near 20.9%, influenced partly by R&D credits consistent with expected benefit profiles [S10].
Revenue growth during Q1 was driven primarily by acquisition contributions plus volume increases on existing contracts despite some completions; operating margin improvement reflected better cost management alongside favorable contract mix effects plus non-recurring gains from investment sales contributing ~$12 million [$F1] [S7][S12]
This solid financial footing supports continued investment in technology capability expansion while maintaining competitiveness within challenging federal spend environments.
This analysis synthesizes publicly filed SEC disclosures as well as verified financial data through mid-2026 without offering specific investment research views or forecasts. It intends solely to provide an informed perspective on SAIC's current strategic positioning within the U.S. federal IT services sector along with emerging risks and growth drivers based on disclosed evidence.
Financial position in context
As of 2026-05-01, companyfacts shows $109mm in cash and equivalents and $2.5bn of total debt [F1]. The same snapshot implies net debt of roughly $2.4bn, keeping balance-sheet context relevant but secondary to the operating story [F1]. Current assets of $1199mm and current liabilities of $1037mm imply a current ratio near 1.16x for 2026-05-01 [F1].
Disclaimer: This is research-only, informational analysis and not investment advice. It may include AI-generated interpretation and general industry context. Always verify important details using primary sources.

Comments