
Seaport Entertainment Group’s Strategic Pivot Amid Operating Losses
Seaport Entertainment integrates hospitality and real estate assets to cultivate future growth despite ongoing financial challenges.
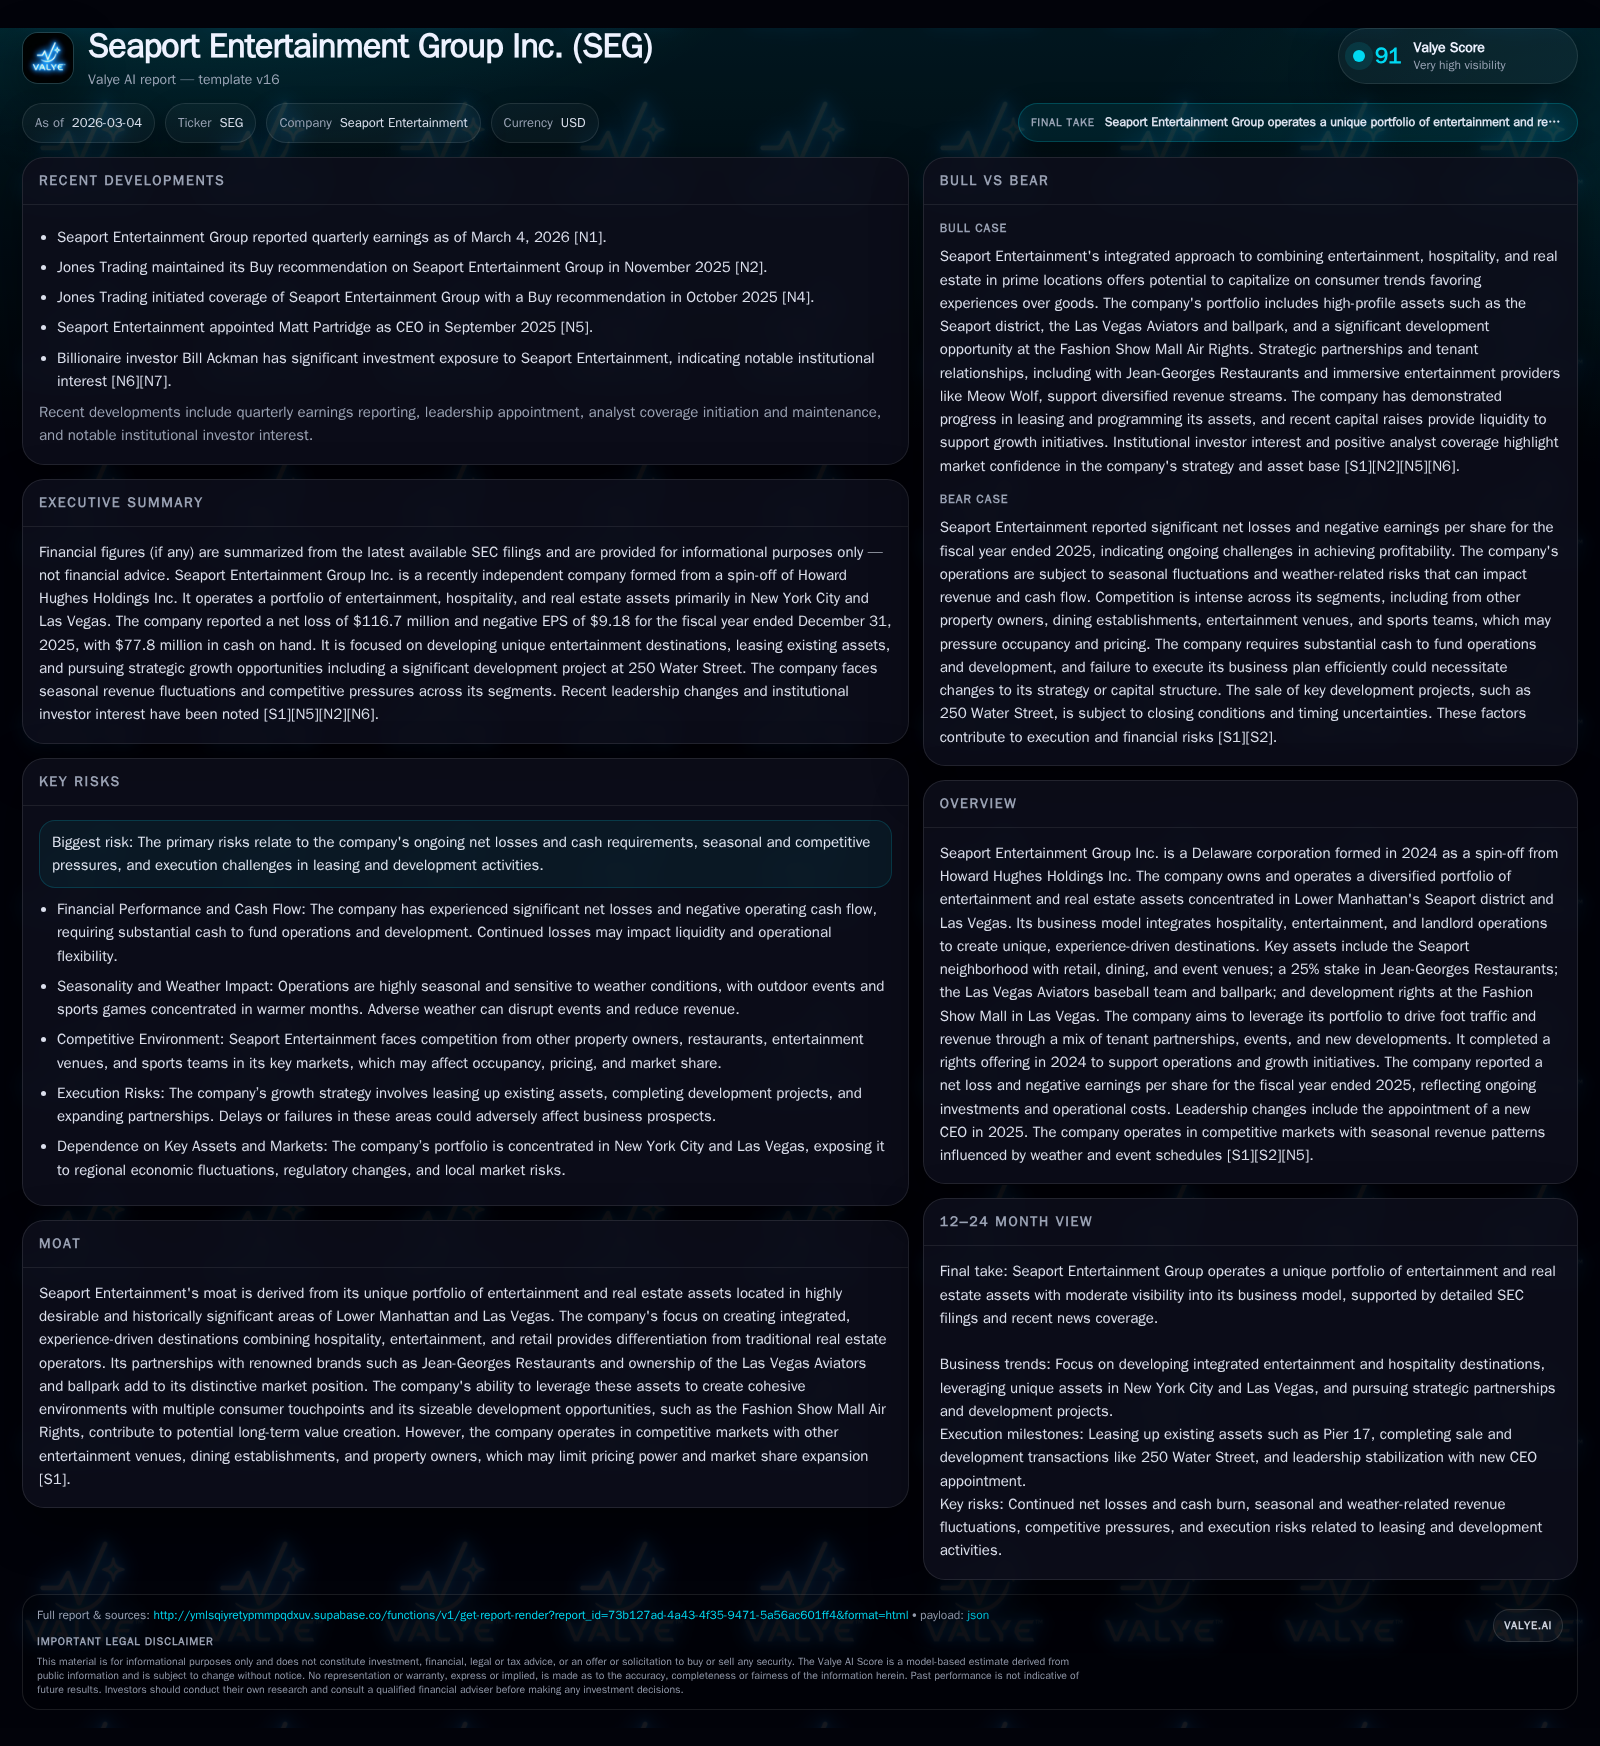
Formed in 2024 as a spin-off of Howard Hughes Holdings, Seaport Entertainment Group operates a unique portfolio spanning New York City's historic Seaport district and Las Vegas. The company’s integrated business model leverages hospitality, dining, entertainment, and landlord operations to build cohesive, experience-driven destinations. While the company reported improved net losses in FY2025, it continues to navigate operating losses amid competitive pressures and seasonal volatility. Its strategic use of capital from a 2024 rights offering supports leasing expansion, culinary ventures, and development projects aimed at enhancing its asset utilization and revenue streams.
Growing Footprints: From Spin-Off Formation to Operational Scale
In July 2024, Seaport Entertainment Group emerged as an independent entity following its spin-off from Howard Hughes Holdings. Deploying a complex yet synergistic portfolio centered primarily in Lower Manhattan's landmark Seaport district and Las Vegas, the company has forged an integrated business model blending hospitality, entertainment services, retail leasing, and real estate ownership [S1]. The flagship New York assets encompass approximately 480,000 square feet dedicated largely to retail dining — including a 25% stake in the highly regarded Jean-Georges Restaurants (JG), known internationally for its Michelin-star credentials and diversified concepts ranging from fine dining to fast casual [S15]. Simultaneously, the company owns the Las Vegas Aviators minor league baseball team along with their modern ballpark facility located in Downtown Summerlin — a venue consistently acclaimed as among the elite Triple-A stadiums nationwide [S15]. Complementing these is Seaport’s controlling interest in development rights above the Fashion Show Mall on the Las Vegas Strip, positioning it to capitalize on future mixed-use entertainment or casino-related projects [S15]. This asset mix allows Seaport Entertainment to harness a flywheel effect where tenant partnerships, events programming, and landlord operations mutually reinforce destination appeal.
Drivers Behind Recent Financial Performance: Improving Margins vs Persistent Losses
Although relatively nascent as a standalone concern, Seaport’s financial performance through FY2025 reveals both progress and headwinds. Operating income declined by roughly 16.1% year-over-year to an operating loss of $118.2 million [F1], reflecting ongoing investments made to scale operations and lease-up efforts. Yet net losses improved substantially by nearly 24%, contracting from -$153.2 million in FY2024 to -$116.7 million in FY2025 [F1] — a signal of operational leverage starting to surface despite persistent negative EBITDA contributions.
Operating cash flow also moved favorably by around 5.8% to negative $49.7 million in FY2025 [F1], suggesting early traction toward narrowing cash burn during higher revenues or enhanced cost controls. A key internal initiative underpinning this margin stabilization was the progressive internalization of food & beverage (F&B) operations that began January 2025. By absorbing Creative Culinary Management Company’s staff formerly outsourced under service agreements with JG-related entities [S5], management sought greater control over operating efficiencies and margin optimization across restaurant venues anchored within their properties.
Historical performance (annual)
| FY | Net ($mm) | CFO ($mm) | OpInc ($mm) | Net YoY |
|---|---|---|---|---|
| 2025 | -117 | -50 | -118 | +23.8% |
| 2024 | -153 | -53 | -102 |
Source: SEC companyfacts cache [F1].
Capital returns and efficiency (annual)
| FY | ROE% |
|---|---|
| 2025 | -25.6 |
| 2024 | -27.3 |
Source: SEC companyfacts cache [F1].
Data source: SEC filings per [F1]; Negative cash flows reflect scale-up costs tied to leasing activities and new ventures.
Challenges in Leasing, Competition, and Seasonality Shaping Outcomes
Despite strategic intent, Seaport operates within fiercely competitive urban hubs that impose leasing execution risks and seasonal revenue fluctuations. The company faces high tenant acquisition costs and retention hurdles typical of premium NYC districts known for stringent demands on location quality, amenity packages, and pricing concessions [S4]. Retail tenants grapple against alternative premier spaces with differentiated foot traffic dynamics; meanwhile specialty dining confronts a crowded landscape from established fine dining brands extending beyond Manhattan into broader New York City markets [S4]. These competitive pressures mirror within its entertainment segment where concert venues vie for audience attention against iconic arenas alongside more intimate experiential sites [S4]. The Las Vegas Aviators play into an intensely competitive sports entertainment market alongside other major league affiliates vying for community engagement [S4].
Seasonality compounds operational complexity with outdoor activities like concerts at The Rooftop at Pier 17 and baseball games concentrated mostly between May and October when weather conditions favor increased patronage [S7]. Inclement weather — floods or snowstorms — lead not only to event cancellations but also supply chain disruptions across F&B outlets that depress revenues during off-peak periods [S7]. This cyclicality generates pronounced fluctuations across working capital accounts throughout the fiscal year.
Strategic Growth Levers: Event Programming, Culinary Ventures, and Development Pipelines
Management’s path forward hinges on leveraging core experiential assets combined with curated tenant partnerships designed to enhance visitor dwell time and dollar spend per capita [S5]. Anchor initiatives include expansion of the Rooftop Concert Series—a marquee venue signaling strong ticket demand evidenced by sold-out shows comprising nearly 90% attendance rates generating over $10 million gross revenues in recent seasons [S21]. Additionally, the lease signed with immersive experience brand Meow Wolf to occupy substantial Pier 17 space signals an innovative content addition expected to amplify foot traffic [S13]. Ongoing efforts culminated recently with a lease agreement for the Balloon Museum set to open at the Tin Building by mid-2026 — occupying an expansive historic venue infused with art-forward programming set to diversify offerings [N1][S17].
Simultaneously, internalizing F&B operations after terminating external service contracts erected tighter operating controls facilitating potential margin improvements while continuing growth through multiple avenues within JG's portfolio—ranging from franchise expansion opportunities to private-label wholesale distribution channels targeting scalable fast casual formats [S5]. Development prospects loom large via ownership of air rights above Las Vegas' Fashion Show Mall where plans contemplate mixed-use developments bridging casinos and hotels aligned with regional tourism growth projections [S15][S21].
Capital Structure Overview and Impact of the 2024 Rights Offering
The company's capital structure reflects deliberate steps taken post-spin-off to fund working capital demands and growth programs while managing leverage prudently amid cyclical uncertainties [S2][S6][S7]. Of note is a significant rights offering completed in October 2024 that raised net proceeds of approximately $166.8 million intended chiefly for general corporate purposes including operating expenses and identified expansions [S2].
Debt instruments include fixed-rate mortgages associated with core real estate holdings such as Two Five Zero Water Street carrying maturities staggered between 2026–2028 alongside variable rate obligations structured around ground leases tied mainly to Pier 17 and other Seaport assets [S7][S11]. Refinancing risk exists given near-term amortizations coinciding with periods of revenue scale-up; however liquidity metrics disclosed suggest adequate covenant compliance supported by positive equity cushions despite recent declines driven by cumulative losses on retained earnings reductions [F1][S29]. Ground leases confer an additional layer of leasehold operational leverage affecting underlying asset economics but also limit absolute control relative to wholly owned real estate such as residential building at 85 South Street which remains unburdened by ground rent commitments [S7][S15].
Analysing Cash Flows, ROE, and Capital Allocation Priorities
Operating cash flow trends underscore persistent negative conversion reflecting ongoing investment outlays essential for asset activation during developmental phases—yet a modest improvement of nearly 6% year-over-year suggests incremental operational efficiencies materializing particularly through internalization strategies cited earlier [F1]. Dividends remain unpaid as capital allocation emphasizes reinvestment prioritization into boost leasing velocity and infrastructure enhancements rather than distributions or stock repurchases at this stage according to latest disclosures [S1][F1].
Return on equity stands deeply negative at roughly -25.6% based on net income relative to shareholders' equity showing challenges ahead in delivering efficient returns amid scale-building timelines; nonetheless this metric must be considered within context of structural investments aiming for longer-term value crystallization through asset repositioning rather than near-term profitability alone [F1].
What to Watch: Upcoming Milestones, Lease Expansions, and Market Dynamics
Monitoring forward-looking catalysts includes close observation of Balloon Museum's Tin Building launch initially scheduled for summer 2026 representing not only additional tenancy fill but also diversified experiential content enhancement drawing broad demographic engagement [N1][S17]. Parallel attention is warranted on progress regarding Fashion Show Mall air rights utilization—the joint venture framework aims at unlocked value via large-scale commercial or casino-hospitality project development but depends materially on regulatory approvals and market conditions affecting major strip properties [S15][S21].
Further indicators involve Jean-Georges’ planned franchise rollouts alongside possibilities for new fast-casual concepts replicable across entertainment destinations seeking operational scalability beyond traditional restaurant margins [S5]. External factors shaping these dynamics include macroeconomic shifts impacting discretionary consumer spending patterns especially leisure travel trends coupled with climate considerations influencing outdoor event reliability imposing further seasonality adjustments on revenue cadence [S4][S9][S22].
This report synthesizes publicly available information as of early March 2026 through SEC filings ([F1],[S#]) and company news releases ([N#]). It endeavors to present an objective overview without providing investment recommendations or forecasts beyond documented disclosures.
Disclaimer: This is research-only, informational analysis and not investment advice. It may include AI-generated interpretation and general industry context. Always verify important details using primary sources.
Comments