
SM Energy's Post-Merger Scale and Divestiture Strategy Shape Growth and Financial Position
The company’s 2025 results reflect integration efforts following the Civitas merger alongside a sizable asset sale aiming to optimize capital structure.
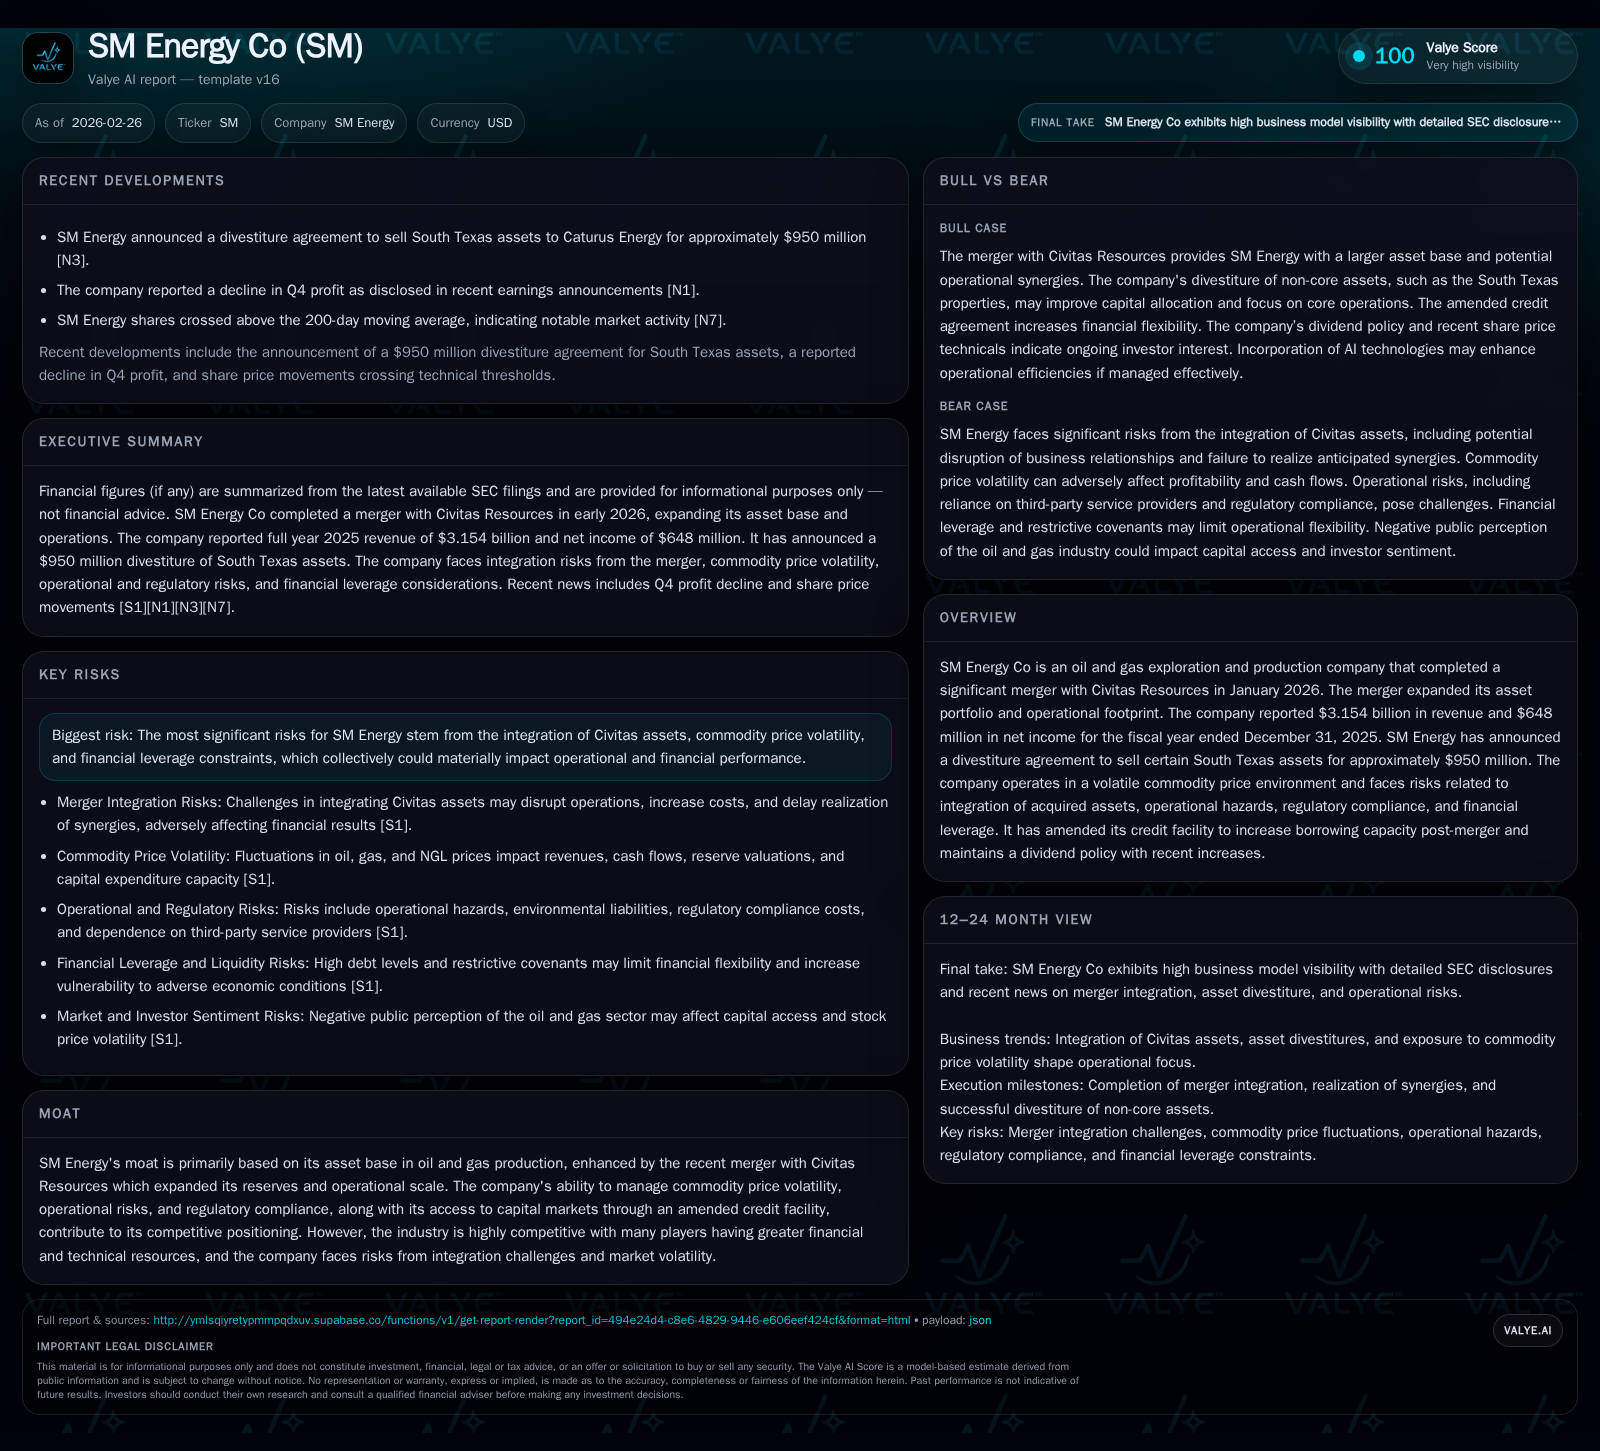
SM Energy Co completed a transformative merger with Civitas Resources in early 2026, substantially expanding its operational footprint and reserves. The fiscal year 2025 saw revenue rise by over 17% as the company prepared for integration costs and strategic asset optimization, including the announced $950 million South Texas divestiture. Despite strong operating cash flow, net income declined amid merger-related expenses and commodity price volatility. SM Energy faces notable risks from integration complexity, high leverage, and regulatory pressures, counterbalanced by increased borrowing capacity and continued dividend policies.
Historical Performance Overview
SM Energy Co reported significant top-line growth in fiscal year (FY) 2025 with revenue reaching approximately $3.15 billion, marking a 17.2% increase from $2.69 billion in FY2024 [F1]. This uptick reflects a combination of increased production volumes attributable partly to pre-merger activity anticipation and favorable commodity pricing trends prevalent through most of the year. However, operating income dipped by around 7% to $1.0 billion from $1.08 billion the previous year, revealing margin compression possibly linked to rising operating costs and merger-related expenses [F1]. Net income declined more sharply by approximately 15.9% to $648 million in FY2025 versus $770 million in FY2024 due largely to these transitional costs and volatility impacts on realized prices [F1].
Despite earnings pressure, operating cash flow improved strongly by nearly 13%, reaching $2.01 billion [F1]. This resilience was supported by prudent working capital management as the current ratio stood at about 0.69 despite increased current liabilities post-merger [F1]. Capital expenditures reported in years prior were modest relative to cash flow generation, enabling substantial free cash flow estimated near $2.02 billion after accounting for capex outlays [F1]. Equity grew significantly to $4.81 billion as of year-end 2025 from $4.24 billion in 2024, reflecting merger consolidation effects [F1].
Historical performance (annual)
| FY | Rev ($bn) | Net ($mm) | CFO ($bn) | OpInc ($mm) | Rev YoY | Net YoY |
|---|---|---|---|---|---|---|
| 2025 | 3.2 | 648 | 2.0 | 1000 | +17.2% | -15.9% |
| 2024 | 2.7 | 770 | 1.8 | 1076 | +13.3% | -5.8% |
| 2023 | 2.4 | 818 | 1.6 | 987 | -29.3% | -26.4% |
| 2022 | 3.4 | 1112 | 1.7 | 1579 |
Source: SEC companyfacts cache [F1].
Capital returns and efficiency (annual)
| FY | Buybacks ($mm) | ROE% |
|---|---|---|
| 2025 | 13 | 13.5 |
| 2024 | 86 | 18.2 |
| 2023 | 228 | 22.6 |
| 2022 | 57 | 36.0 |
Source: SEC companyfacts cache [F1].
Note: Dividend payments are subject to board discretion; buyback activity tapered substantially in FY2025.
Merger Impact and Future Growth Prospects
The cornerstone event shaping SM Energy’s current profile is the completion of its merger with Civitas Resources on January 30, 2026 [N6][S1]. This transformative transaction has nearly doubled the company’s scale in terms of reserves and operational footprint but brings significant integration complexity risks [S22][S8][S21]. Management expects incremental transaction costs extending into parts of FY2026 mainly encompassing legal fees, change-in-control payments, system harmonization efforts, and potential workforce realignment expenses.
Strategically, the merged entity aims to capitalize on enhanced scale for operating efficiencies while gradually rationalizing overlapping assets or underperforming regions [N6]. To that end, SM Energy announced a divestiture agreement for certain South Texas assets valued at roughly $950 million with buyer Caturus Energy [N6][N9]. Proceeds from this transaction are earmarked for deleveraging—addressing the markedly increased debt load acquired alongside Civitas—and funding selective capital projects that target higher return profiles.
While commodity price volatility remains an ever-present constraint influencing revenue predictability and investment capacity [S22], SM Energy’s asset quality post-merger positions it competitively within prolific U.S.-based plays such as the Permian Basin where pipeline takeaway constraints affect many operators but have been somewhat mitigated by strategic infrastructure contracts [S16][S28].
Future growth will depend on successful integration outcomes, disciplined capital deployment amid uncertain macro conditions including inflationary pressures on drilling costs, regulatory compliance demands particularly regarding emission standards and hydraulic fracturing restrictions across multiple jurisdictions [S15][S23][S26], and market demand sustainability influenced by global geopolitical dynamics [S21]. Analysts anticipate near-term earnings softness flagged ahead of Q4 ’25 earnings release due partly to these transitional factors [N4][N5].
Capital Structure and Returns Profile
Post-merger leverage expanded significantly; SM Energy assumed Civitas’s senior notes totaling about $4.9 billion alongside its existing notes nearing $2.7 billion outstanding at December end [S4][S10][F1]. This elevated total indebtedness situates long-term debt at a sizeable proportion of overall capitalization (approximate book equity at $4.81 billion versus high billions in combined debt) which introduces substantial interest servicing obligations potentially restricting flexibility.
The company amended its credit agreement concurrently with the merger closing—extending maturities out to January 2031—and increased committed revolving loan capacity from $2 billion up to $2.5 billion while augmenting borrowing base limits from $3 billion up to $5 billion reflecting updated reserve valuations [S10][S11]. As of early February 2026 no balances were drawn on revolvers indicating liquidity preservation amidst integration execution.
Dividend policy remains active though subject to board discretion in light of covenants limiting restricted payments including dividends and repurchases under credit agreements—a common restrictive feature reflecting leveraged profiles in mid-cap exploration & production firms [S6][S20]. Recent payout increases have been disclosed but future actions will weigh earnings trajectory against evolving debt coverage metrics.
Share repurchase programs continue but at sharply reduced levels relative to pre-merger activity as cash is prioritized for deleveraging and capex support; recent buybacks totaled just $13 million during FY2025 compared to over $228 million in FY2023 [F1].
Return on equity approximates mid-teens (~13.5%) when computed using reported net income against equity balance reflecting post-merger scale dilution effects but consistent with capital-intensive sectors confronting cyclicality [F1]. Robust operating cash flows provide a buffer facilitating capital reinvestment or debt reduction choices crucial to navigating ongoing volatility risk.
Industry Context and Risk Environment
SM Energy operates within a fiercely competitive landscape populated by larger peers possessing deeper financial reserves and advanced technical capabilities who compete aggressively for acreage consolidation and production efficiency gains [S22][S29]. Market sentiment towards oil & gas equities remains mixed given sustained environmental scrutiny alongside fluctuating global supply-demand dynamics.
Regulatory regimes governing air quality (e.g., NSPS), methane emissions monitoring mandates particularly in Uinta Basin areas where SM holds operations, hydraulic fracturing standards, produced water disposal restrictions including seismic response areas designation in Texas introduce layers of operational complexity potentially elevating compliance costs or causing drilling delays [S15][S24][S26]. These are compounded by macro uncertainties such as inflation-driven cost inflation across labor/equipment segments plus possible political/legal challenges stemming from merger-related shareholder litigation threats noted post-Civitas combination [S25].
Asset concentration risks include dependence on third-party infrastructure pipelines/storage limiting market access if disruptions occur unexpectedly [S7] alongside reliance on partnerships for non-operated properties posing coordination challenges.
Emerging technological integrations involving artificial intelligence offer potential process efficiencies but also expose companies like SM Energy to premature adoption pitfalls such as compliance gaps or unintended reputational risks necessitating careful governance frameworks going forward [S19][S29].
Conclusion
As SM Energy transitions into a larger-scale enterprise shaped decisively by early-2026 Civitas merger events, its financial results depict both the benefits of expanded upstream footprint and the strain posed by integration expenses along with leveraged balance sheet management challenges.
Revenue growth confirmed positive momentum through FY2025 but profitability contrasts reveal near-term margin pressures amplified through one-off transaction charges together with underlying commodity unpredictability.
Capital structure enhancements via amended revolving credit lines reinforce liquidity cushions vital during such structural changes while dividend continuity signals sustained shareholder return intent within measured risk tolerance boundaries.
Investors monitoring SM Energy should closely watch progress against merger synergy realization milestones scheduled throughout calendar-year 2026 alongside divestiture completions like the South Texas sale which underpin deleveraging pathways essential for fortifying medium-term financial health.
Operational execution amidst tightening environmental scrutiny alongside cyclical input cost factors will critically influence how SM Energy converts newfound scale advantages into durable platform growth across competitive U.S resource plays.
This analysis is based solely on public filings including the company’s latest Form 10-K dated February 26, 2026 ([S1]-[S29]), recent news reports ([N#]) cited herein, and validated financial data from SEC XBRL structured information ([F1]). It is intended for informational purposes without making investment recommendations or forecasts beyond stated facts.
Disclaimer: This is research-only, informational analysis and not investment advice. It may include AI-generated interpretation and general industry context. Always verify important details using primary sources.
Comments