
Surf Air Mobility Solidifies Niche with Essential Air Service Contracts Amid Financial Headwinds
Surf Air Mobility leverages exclusive federal contracts to serve underserved regional routes, facing mounting liquidity challenges despite revenue gains.
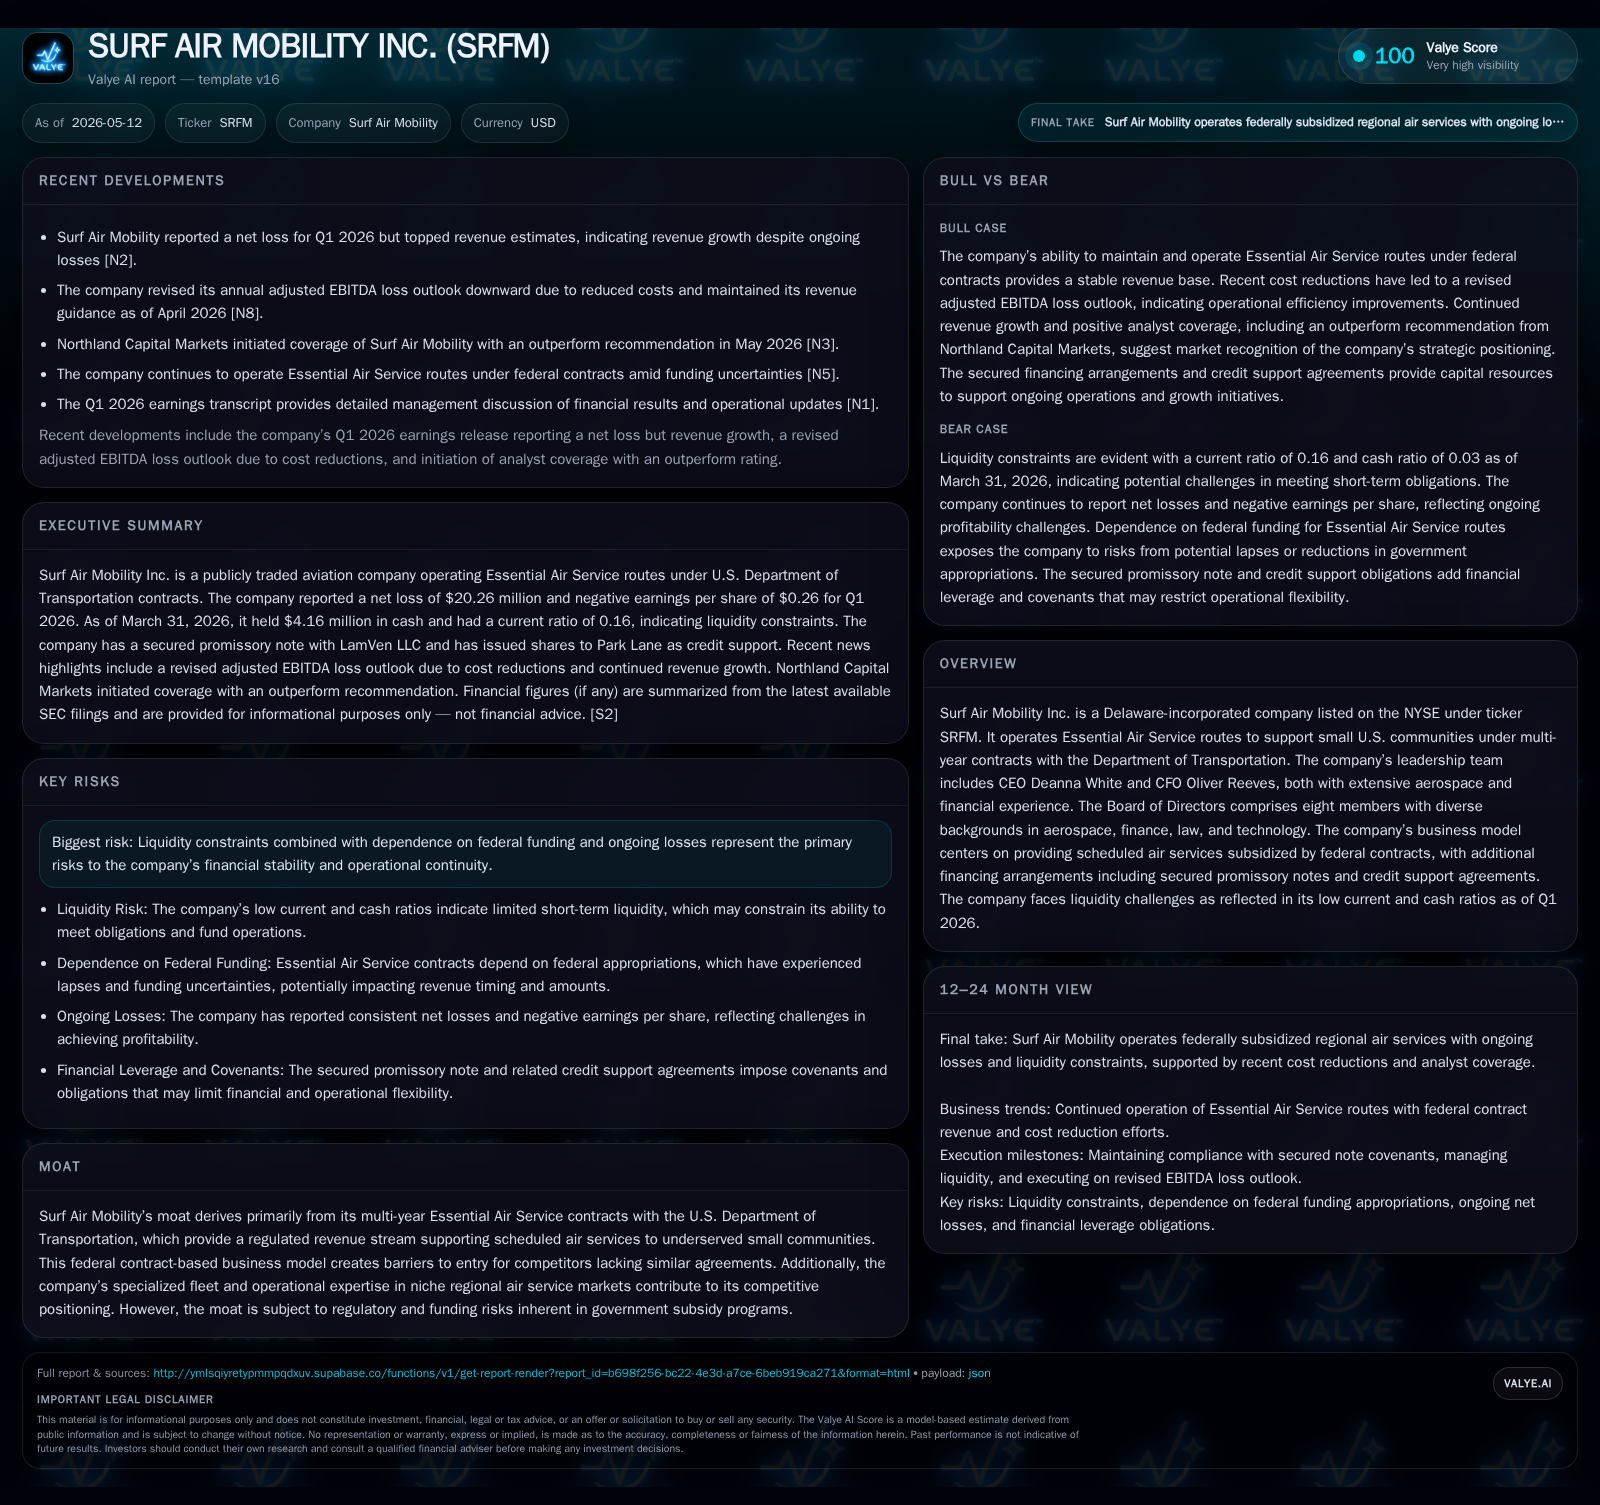
In Q1 2026, Surf Air Mobility outpaced revenue expectations but continued to report significant operating losses and deteriorating liquidity ratios. The company's business model depends heavily on multi-year federal Essential Air Service (EAS) contracts that subsidize air routes serving small U.S. communities, establishing regulatory barriers and a defensible niche. However, growing current liabilities and limited cash reserves present substantial financial risks amid uncertain federal funding continuity. Growth hinges on contract renewals, fleet modernization, and operational efficiencies while closely monitoring government appropriations and execution milestones.
Latest Quarterly Operating Update Highlights
Surf Air Mobility's Q1 2026 results illustrated a mixed trajectory marked by revenue outperformance yet sustained heavy operating losses. As detailed in the May 11, 2026 10-Q filing [S2] and the concurrent 8-K press release [S3], the company exceeded revenue estimates driven primarily by ongoing Essential Air Service contract operations. Nevertheless, it continued to report net losses indicative of high fixed costs and operational inefficiencies inherent in regional air service markets. Critically concerning is Surf Air’s working capital position: ending Q1 with roughly $4.16 million in cash against $132.9 million in current liabilities generates a razor-thin current ratio of 0.16 [F1]. This imbalance flags pronounced liquidity pressure that constrains operational flexibility and heightens refinancing risk within a challenging funding environment.
Business Model Rooted in Essential Air Service Contracting
Surf Air Mobility operates primarily under multi-year contracts with the U.S. Department of Transportation's Essential Air Service (EAS) program designed to subsidize scheduled air services for smaller U.S. communities that would otherwise lack adequate connectivity [S1]. These federally funded contracts constitute the backbone of Surf Air's revenue model by guaranteeing a regulated stream of subsidies tied to route operation compliance metrics. Customers—essentially small municipalities reliant on dependable air links—benefit from subsidized schedules while Surf Air leverages these engagements to underpin its narrowcast regional flight offerings.
This reliance on government contracts produces both strength and vulnerability. On one hand, it erects meaningful entry barriers due to DOT's controlled route allocations and the multi-year nature of agreements; competitors cannot easily encroach without winning formal DOT approval processes. On the other hand, this model concentrates revenue sources around public funding subject to political and budget variability.
Operationally, Surf Air specializes its fleet composition to address specific short-haul regional demands with aircraft optimized for lower-volume routes—a strategic fit uncommon among broader commercial carriers. This fleet expertise supports consistent service level adherence required by federal contracts, reinforcing customer retention tied to contractual tenure.
Position in Regional Aviation Market and Competitive Moat
Within the fragmented regional aviation ecosystem characterized by thin margins and high regulatory oversight, Surf Air Mobility holds a defensible market position through its collection of exclusive EAS contracts [S1]. The company’s niche focus sidesteps head-to-head competition typical of large carriers by serving less trafficked routes made viable only via government subsidies.
The competitive moat is thus structurally rooted not just in regulatory limitations—precluding license-free market entry—but also in established contractual exclusivity with the DOT that disincentivizes or outright bars competitors lacking replacement agreements. Moreover, specialized fleet capabilities enhance switching costs for communities reliant on Surf Air’s tailored service model.
While competitors can exist within auxiliary or charter sectors, few have matched Surf Air's combined regulatory authorization and operational specialization focused explicitly on the EAS corridor segments.
Growth Drivers Supported by Federal Subsidies and Fleet Development
Near- to medium-term growth prospects for Surf Air hinge first on successful renewals of its suite of EAS contracts across multiple small markets—a prerequisite for maintaining the steady revenue baseline for operations [S2][N8]. Given that these contracts are periodically subject to competitive rebidding by the DOT [S1], maintaining or expanding route portfolios will critically influence growth trajectories.
Complementing contractual factors are emerging initiatives around fleet modernization with implications for operational cost efficiency and service sustainability. Specifically, plans or progress towards deploying more energy-efficient or potentially electrified regional aircraft could lower per-route costs over time while aligning with evolving environmental regulations and public sector expectations [N8].
Additionally, scaling route coverage or improving operational efficiencies through optimized scheduling could marginally boost profitability given thin margins endemic in regional aviation.
Risks Centered on Liquidity Constraints and Funding Dependency
Liquidity emerges as the paramount risk confronting Surf Air Mobility as underscored by its Q1 2026 current ratio at a precarious 0.16 against sizeable current liabilities exceeding $130 million [F1][S2]. Limited unrestricted cash reserves (~$4.16 million) sharply restrict day-to-day operational breathing room or capacity to absorb unforeseen expenses without urgent external financing support.
This fragile liquidity position compounds dependency on consistent federal appropriations underpinning EAS subsidies; any delays or interruptions tied to political cycles or budget negotiations could abruptly disrupt income flows [S10]. The potential for retroactive reimbursements has precedent but lacks guaranteed commitment following recent government shutdown scenarios affecting program funding continuity.
Moreover, ongoing negative operating income pressures—as evidenced by persistent quarterly losses—further erode financial resilience and heighten refinancing risks given outstanding secured convertible promissory notes with restrictive covenants [S29]. These constraints may limit strategic maneuvering amid tightening credit availability.
Key Upcoming Milestones and Market Signals to Monitor
To gauge Surf Air's near-term execution viability and market trajectory, several specific milestones warrant attention:
- Outcomes from upcoming DOT Essential Air Service contract bidding rounds determine whether Surf Air retains or expands critical federally subsidized routes [S2].
- Federal budgetary proceedings impacting EAS program appropriations remain central; signals from Congress regarding funding continuity or changes directly affect subsidy flows [S10].
- Quarterly earnings releases post-Q1 provide insights into margin evolution amid cost management efforts [S2].
- Financing activities including note conversions or potential new equity raises could materially influence balance sheet strength given acute liquidity pressures [S29].
- Regulatory developments around aircraft certifications or environmental compliance linked to fleet advancements may redefine cost or operational profiles [N8].
These indicators collectively frame an evolving landscape where successful contract maintenance coinciding with strategic financial adjustments will be vital.
Financial Snapshot and Capital Structure Overview
Latest financial snapshot
| Metric | Value | Period |
|---|---|---|
| Cash & equivalents | $4mm | |
| 2026-03-31 | ||
| Current assets | $21mm | |
| 2026-03-31 | ||
| Current liabilities | $133mm | |
| 2026-03-31 | ||
| Current ratio | 0.16x | |
| 2026-03-31 |
Source: SEC companyfacts cache [F1].
| Metric | Value (USD) | Period End |
|---|---|---|
| Cash & Equivalents | $4,163,000 | |
| 2026-03-31 | ||
| Current Assets | $21,058,000 | |
| 2026-03-31 | ||
| Current Liabilities | $132,926,000 | |
| 2026-03-31 | ||
| Current Ratio | 0.16 | |
| 2026-03-31 |
The balance sheet reflects an acute mismatch between current asset liquidity and short-term obligations underlining serious funding strain [F1]. Net debt approximates $44 million when adjusting total debt positions for available cash buffers [F1], layering an additional leverage dimension amid ongoing operating deficits noted at prior fiscal year-end levels [$77 million operating loss in FY2025 end] [F1].
It does not constitute investment advice but rather an informed operational overview based strictly on disclosed evidence.*
Disclaimer: This is research-only, informational analysis and not investment advice. It may include AI-generated interpretation and general industry context. Always verify important details using primary sources.
Comments