
T1 Energy Advances Solar Manufacturing Capacity Amid Capital-Intensive Expansion and Liquidity Management
Recent convertible notes offering fuels construction of 2.1 GW G2_Austin solar cell fab, spotlighting growth amidst regulatory and capital execution risks.
T1 Energy Inc. reported first-quarter 2026 results confirming progress in its solar cell manufacturing expansion led by the new G2_Austin fabrication facility. A $184 million convertible senior notes issuance in April 2026 provides substantial funding for its capital-intensive buildout, supporting scale-up in next-generation solar technologies. While demand drivers remain structural given accelerating energy transition imperatives, execution risk around project construction, supplier concentration, and regulatory compliance persists. The company’s leadership team and board bring strong industry and finance expertise to navigate complexities in a competitive energy sector landscape.
Recent Operating Update
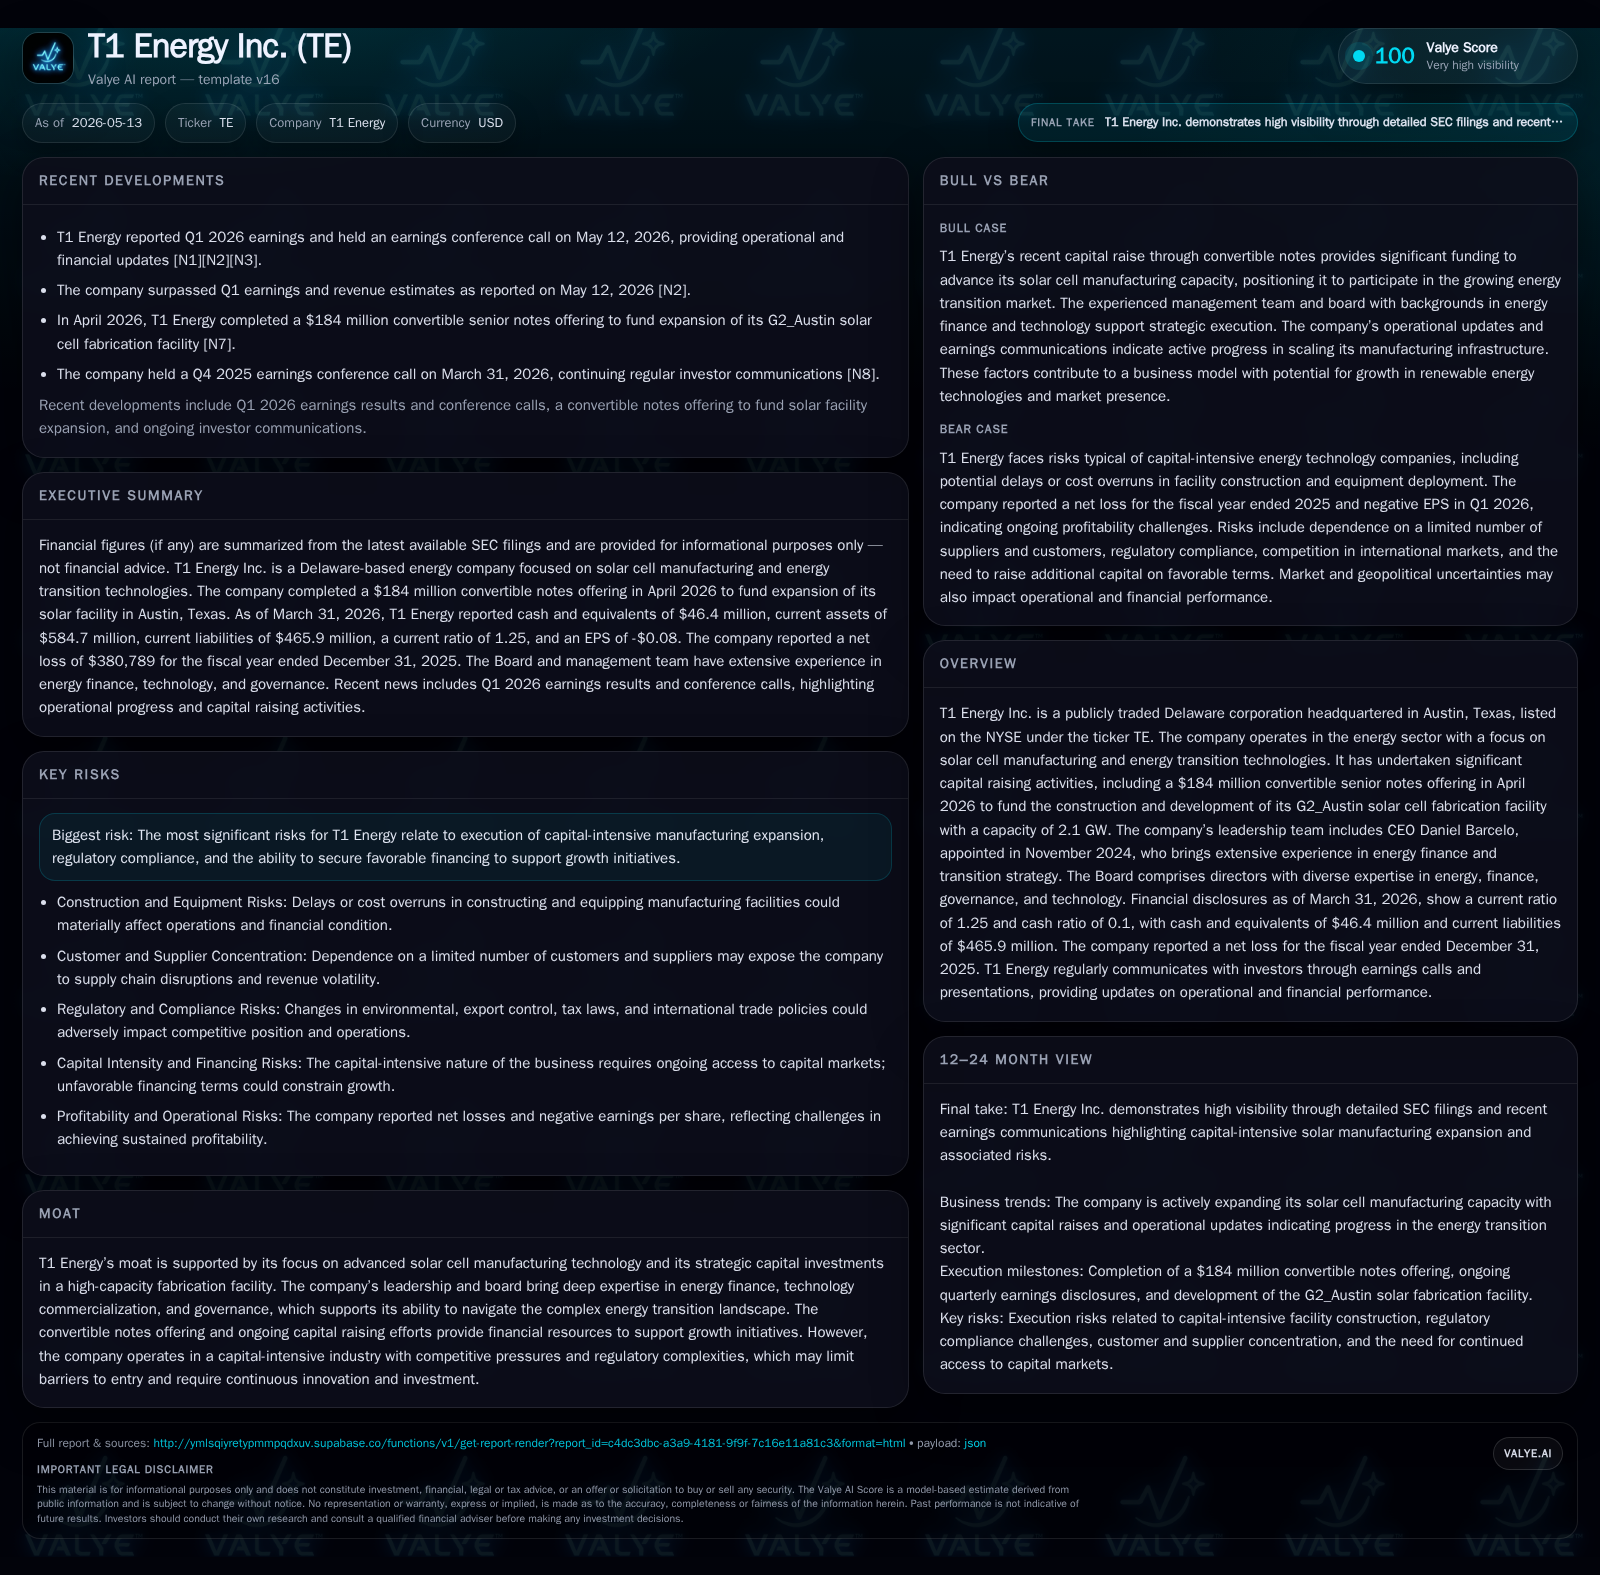
T1 Energy Inc.'s latest quarterly report on May 12, 2026 (10-Q) anchored this review by providing recent operational insights into the company's ongoing solar manufacturing expansion [S2]. The first quarter reflected the continuation of capital-intensive investments primarily aimed at developing the G2_Austin solar cell fabrication facility targeting a sizeable capacity of approximately 2.1 GW. This facility is designed to position T1 as a significant domestic producer in advanced solar cells during increasing demands from utilities and large-scale projects.
On the same day as the earnings release, T1 furnished an earnings call presentation elaborating on the quarter's financial and operational outcomes to investors [S3]. Earlier in April, T1 successfully completed a public offering of $184 million aggregate principal amount of convertible senior notes due in 2031 [S12]. Net proceeds from this issuance (approximately $174.7 million after expenses) are dedicated predominantly to constructing infrastructure and acquiring equipment for Phase 1 of its G2_Austin fab [S18]. This significant capital raise underscores the company's commitment to scaling production capabilities while highlighting the capital intensity involved.
There were no material updates to risk factors compared to the prior year's disclosures noted in the form 10-K/A amendment filed April 30, 2026 [S11], reaffirming challenges centered around execution risk, regulatory adherence, financing availability, and supply chain complexity.
Business Model Overview
T1 Energy operates broadly within the energy transition ecosystem focusing on the design, manufacturing, and commercialization of high-efficiency solar cells. Its primary revenue stream emanates from selling advanced photovoltaic components used by downstream solar panel assemblers or directly through energy projects requiring specialized solar technologies [S1]. Customers effectively pay for cutting-edge manufacturing output incorporating proprietary or advanced production techniques that yield enhanced efficiency and reliability.
Revenues are driven by volume scaling through expanding fab capacity combined with pricing levels influenced by component specification complexity, technology differentiation, and market supply-demand dynamics. Margins tend to be sensitive to production yields, input costs (notably polysilicon), economies of scale attainment during fab ramp-ups, and geographic or policy-driven regulatory impacts influencing customer uptake.
The recent capital raising to fund expansion reflects reliance on periodic large-scale investments typical for semiconductor-style solar fabs. This necessitates close financial stewardship given upfront fixed costs before volume production stabilizes cash flows.
Industry Structure and Competitive Position
The solar cell manufacturing industry is characterized by rapid technological innovation alongside intensifying competition principally from established players across Asia (e.g., China’s dominant polysilicon producers) as well as emerging U.S.-based entities like T1 targeting localized production advantages. Trade policies, tariffs, environmental regulations, and incentives significantly shape competitive dynamics.
T1’s strategic moat lies in its Austin-based G2_Austin high-capacity fab leveraging next-gen production techniques that could improve cost efficiency relative to offshore competitors while addressing U.S. policy emphasis on domestic content requirements within renewable energy supply chains [N2]. Its leadership team combines deep expertise in energy finance, manufacturing operations, and technology commercialization—an asset amid complex project management challenges relevant to fab construction and market penetration [S1].
However, competitive risks include aggressive pricing tactics by entrenched suppliers, potential technological obsolescence if innovation lags peers, supplier concentration exposing input cost volatility (notably rare or proprietary materials), and regulatory hurdles complicating cross-border sales.
Growth Drivers
Growth for T1 Energy is structurally supported by accelerating transitions toward renewable energy worldwide driven by climate mandates legislated at federal/state levels along with private sector commitments. Key growth vectors include:
- Capacity Expansion: Incremental increases in G2_Austin fab output will scale volumes and potentially improve cost per watt delivered.
- Technological Advancement: Improvements in cell efficiency through R&D efforts facilitate expanded adoption among residential/commercial projects seeking better ROI.
- Policy Incentives: Eligibility for advanced manufacturing tax credits (e.g., IRS Section 45X) can materially reduce effective capital costs enhancing margin profiles [S5].
- Customer Diversification: Expanding relationships beyond select utility-scale clients into more fragmented commercial or industrial sectors can broaden sales base.
- Supply Chain Localization: Increasing domestic sourcing aligns with governmental priorities reducing tariff-related uncertainties.
These drivers depend heavily on successful plant commissioning schedules and stable macroeconomic conditions underpinning demand for renewables.
Risks and Watchpoints
T1 faces multiple layered risks balancing opportunity against execution demands:
- Capital Intensity & Financing Risk: Total debt stood at approximately $404.5 million as of March-end 2026 with net debt near $358 million after cash offsets, and a current ratio of 1.25x indicating moderate short-term liquidity coverage [F1].
- Execution Risk: Delays or cost overruns related to G2_Austin fab construction could materially impact timing of revenue recognition.
- Regulatory Compliance: Adhering to evolving environmental standards, export/import control regimes or failing qualification for key tax incentives could impair profitability [S5].
- Supply Chain Concentration: Dependence on limited suppliers for critical raw materials introduces vulnerability to procurement disruptions or elevated input costs.
- Management Changes: The retirement of Chief Development Officer Einar Kilde in April could temporarily affect project execution continuity; however new hires align with strategic direction [S16].
- Market Competition: Enhanced competition from international incumbents may pressure prices or limit market share gains despite technological investments.
What to Watch Next
Investors should monitor:
- Progress reports or guidance updates relating to buildout timelines for Phase 1 at G2_Austin fab including start of commercial production milestones.
- Announcements regarding additional financing needed beyond $184 million convertible notes completed in April—especially debt terms influencing leverage profile.
- Updates on qualification or realization of tax credits such as Section 45X that materially impact capital recovery economics.
- Production yield rates as the new facility scales operations indicating efficiency gains or potential bottlenecks.
- Customer contract wins particularly with diversified segments indicating broadening market penetration beyond initial utility-scale targets.
- Regulatory changes at state/federal level impacting domestic manufacturing incentives or cross-border trade policies relevant to exports.
Financial Snapshot (As of Q1 Ending March 31, 2026) [F1]
Latest financial snapshot
| Metric | Value | Period |
|---|---|---|
| Cash & equivalents | $46mm | |
| 2026-03-31 | ||
| Total debt | $405mm | |
| 2026-03-31 | ||
| Net debt | $358mm | |
| 2026-03-31 | ||
| Current assets | $585mm | |
| 2026-03-31 | ||
| Current liabilities | $466mm | |
| 2026-03-31 | ||
| Current ratio | 1.25x | |
| 2026-03-31 |
Source: SEC companyfacts cache [F1].
Operating income remains negative due to upfront investment phases typical for growth-stage fabs but is expected to improve once commercial volumes stabilize [F1].
This analysis was prepared based solely on available public SEC filings up through May 13, 2026; no speculative forward-looking information was inferred beyond stated disclosures. It does not represent investment advice or recommendations but aims to provide a grounded industry-focused assessment relevant for buy-side analysts evaluating T1 Energy Inc.'s operational positioning within the solar manufacturing space.
Disclaimer: This is research-only, informational analysis and not investment advice. It may include AI-generated interpretation and general industry context. Always verify important details using primary sources.
Comments