
TRIO-TECH INTERNATIONAL's Latest Quarter Signals Shift in Growth and Liquidity Dynamics
Recent capital raise and lease acquisition enhance liquidity and scalability despite ongoing profitability pressures.
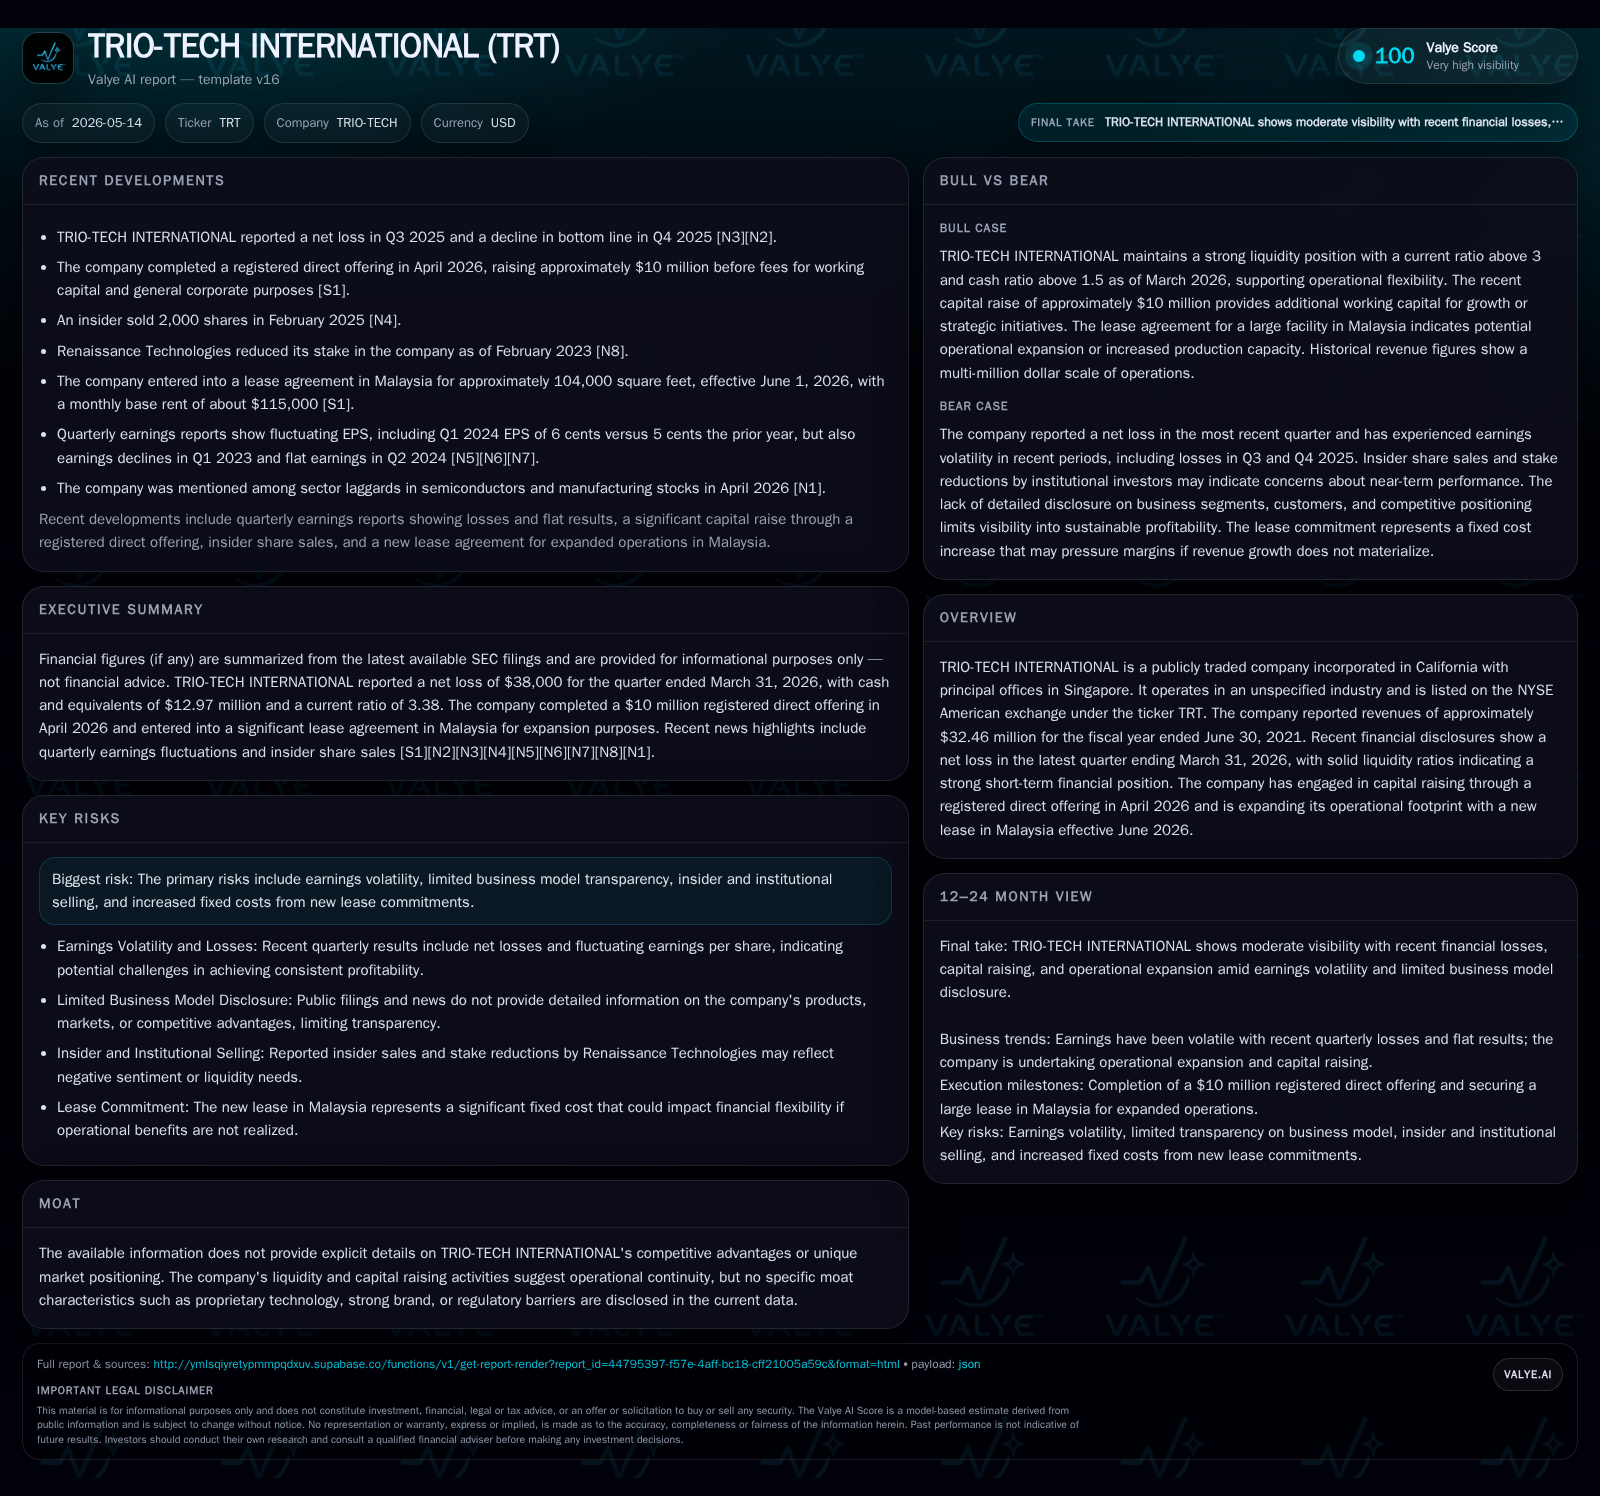
Trio-Tech International’s 10-Q for the quarter ended March 31, 2026, reveals a strategic pivot underscored by a $10 million registered direct offering closed in April 2026, bolstering its cash position amid continuing net losses. The recent lease agreement for over 100,000 square feet in Malaysia signals an operational expansion aimed at unlocking regional growth opportunities. These developments improve the liquidity runway, reflected in a robust current ratio of 3.38, while highlighting ongoing challenges related to earnings volatility and limited business model transparency.
Recent Operating Update: Capital Infusion and Geographic Expansion
Trio-Tech International’s latest quarterly filing dated May 14, 2026 (10-Q) captures a noteworthy evolution of its near-term operational posture. The company finalized a registered direct offering in late April totaling approximately $10 million gross proceeds at $9.50 per share [S4][S5]. This infusion materially fortifies the company’s liquidity profile amidst persistent net losses reported for the quarter ending March 31, 2026 [S2]. Cash and equivalents stood at $12.97 million alongside a current ratio exceeding 3.3, reflecting solid short-term financial flexibility despite the negative earnings trajectory [F1].
Strategically significant is Trio-Tech’s entry into a sizable lease agreement for roughly 104,000 square feet in Penang, Malaysia, effective June 1, 2026 [S18][S19]. The monthly base rent of approximately $115,000 plus associated taxes and deposit underscores a commitment to expand physical operations within Southeast Asia. While this elevates fixed overhead costs going forward, management appears to position this move as foundational for scaling capacity and tapping broader regional demand.
Together, these developments signal an operational shift not only in capital structure but also geographic footprint. The timing between securing fresh equity funding and committing to long-term space suggests bolstered confidence in future growth trajectories despite the inherent execution risks.
Business Model Overview: Core Offerings and Customer Value Proposition
Concrete details about Trio-Tech's industry segment and precise product offerings are notably absent from public filings, creating opacity around its core value proposition [S2][S3]. However, as a company incorporated in California with principal offices in Singapore—and now expanding into Malaysia—one can infer the presence of manufacturing or tech-related services likely integrated across Asia-Pacific markets.
Revenue mechanics presumably involve contract-based sales or service agreements given references to working capital usage patterns post-offering. The absence of explicit indication regarding recurring revenue streams or subscription models limits assessment of customer retention dynamics or switching costs.
Given the lack of clearly delineated proprietary technology or brand differentiation disclosed, customer purchasing decisions may lean heavily on cost competitiveness or strategic location advantages offered by Southeast Asian operations.
This opacity presents challenges when evaluating pricing power or long-term unit economics; however, it also suggests that inducing customer adoption may hinge on geographic expansion as much as product merit.
Industry Environment: Positioning Within a Disclosed Competitive Set
Trio-Tech operates without an identifiable moat or regulatory barriers to entry per current disclosures. The company's need to pursue substantial capital raises points toward competitive pressures that limit organic cash flow generation.
Profitability remains volatile with recurring quarterly net losses despite attempts at operational scaling [S2][F1]. This environment likely reflects fragmented industry competition or commoditized offerings where differentiation is elusive.
Regulatory exposures are not explicitly outlined but cybersecurity risk was recently materialized through a ransomware incident affecting a subsidiary in Singapore earlier in Q1 2026 [S17], injecting additional uncertainty.
The company's placement within the industry value chain is unclear but the emphasis on facility expansion suggests involvement in manufacturing or logistics components where scale economies matter yet competitive intensity remains high.
Growth Drivers: Leveraging Capital and Footprint Expansion to Unlock Demand
The subsequent lease agreement aligns with the April 2026 registered direct offering by establishing significant physical capacity expansion commencing June 2026 [S18][S19].
This Malaysian facility provides the company access to key industrial zones near critical supply chain nodes within Penang’s manufacturing ecosystem. The sizable space enhances Trio-Tech’s ability to increase throughput or diversify product lines assuming operational execution meets planning.
Growth hinges on translating this expanded footprint into incremental demand capture either via existing customers requiring increased volume or penetration into adjacent accounts where proximity offers logistic or cost advantages.
The availability of over $12 million liquid assets supports this runway but underlines reliance on disciplined capital allocation to narrow ongoing losses while scaling production effectively.
Risks and Constraints: Volatility, Cost Base, and Transparency Challenges
The primary risk overlays relate to persistent earnings volatility as Trio-Tech continues reporting quarterly net losses amidst attempts at growth [S2][F1]. Such financial strain could impair investor confidence especially given insider and institutional selling pressures referenced indirectly through disclosure limitations.
Fixed cost escalation from leasing over $100k monthly starting mid-2026 introduces leverage that magnifies downside if anticipated revenue gains do not materialize timely [S18]. This elevated break-even burden tightens margin pressure especially lacking clear pricing power disclosures.
Cybersecurity threats remain salient following the March ransomware event impacting one operating subsidiary’s network with incomplete resolution timeline; potential material liability lingers [S17].
Opaque business model descriptors further challenge external evaluation of sustainability; limited transparency perpetuates higher risk perceptions which could constrain access to favorable financing terms going forward.
What to Watch Next: Upcoming Milestones and Execution Watchpoints
Key near-term indicators will revolve around Trio-Tech’s ability to judiciously deploy capital raised from the April offering toward effective scaling initiatives tied to the Malaysian lease activation in June [S3][S18]. Success metrics include progress reports on operational ramp-up efficiency reflecting utilization rates of new facilities.
Monitoring quarterly cash burn trends alongside net income evolution will provide signals on whether liquidity strengths are being maintained amid investment outlays [F1][S2].
Any updates on mitigating cybersecurity exposure transparently will be critical for investor sentiment given prior ransomware disclosures.
Additionally, indications of shifts in business model clarity or enhanced reporting practices would address prevailing transparency concerns materially influencing market perceptions.
Finally, follow-on financing activities or notable changes in insider shareholding patterns may flag evolving confidence levels inside management ranks.
Latest Financial Snapshot
Latest financial snapshot
| Metric | Value | Period |
|---|---|---|
| Cash & equivalents | $13mm | |
| 2026-03-31 | ||
| Total debt | $515,000 | |
| 2026-03-31 | ||
| Net debt | $-12mm | |
| 2026-03-31 | ||
| Current assets | $33mm | |
| 2026-03-31 | ||
| Current liabilities | $10mm | |
| 2026-03-31 | ||
| Current ratio | 3.38x | |
| 2026-03-31 |
Source: SEC companyfacts cache [F1].
| Metric | Value (USD) |
|---|---|
| Cash & Equivalents | 12,970,000 |
| Total Debt | 515,000 |
| Net Debt | -12,455,000 |
| Current Assets | 33,273,000 |
| Current Liabilities | 9,855,000 |
| Current Ratio | 3.38 |
This financial snapshot as of March 31, 2026 highlights Trio-Tech’s robust liquidity position underscored by a strong current ratio significantly above one—a positive buffer supporting short-term obligations despite generating net quarterly losses [F1]. Readers should conduct their own due diligence before making any financial decisions concerning TRIO-TECH INTERNATIONAL (TRT).
Disclaimer: This is research-only, informational analysis and not investment advice. It may include AI-generated interpretation and general industry context. Always verify important details using primary sources.

Comments