
TAL Education's 2026 Quarter Highlights Regulatory and Business Model Nuances
Latest quarterly results reveal TAL Education navigating operational growth amidst complex VIE risks and evolving regulatory constraints.
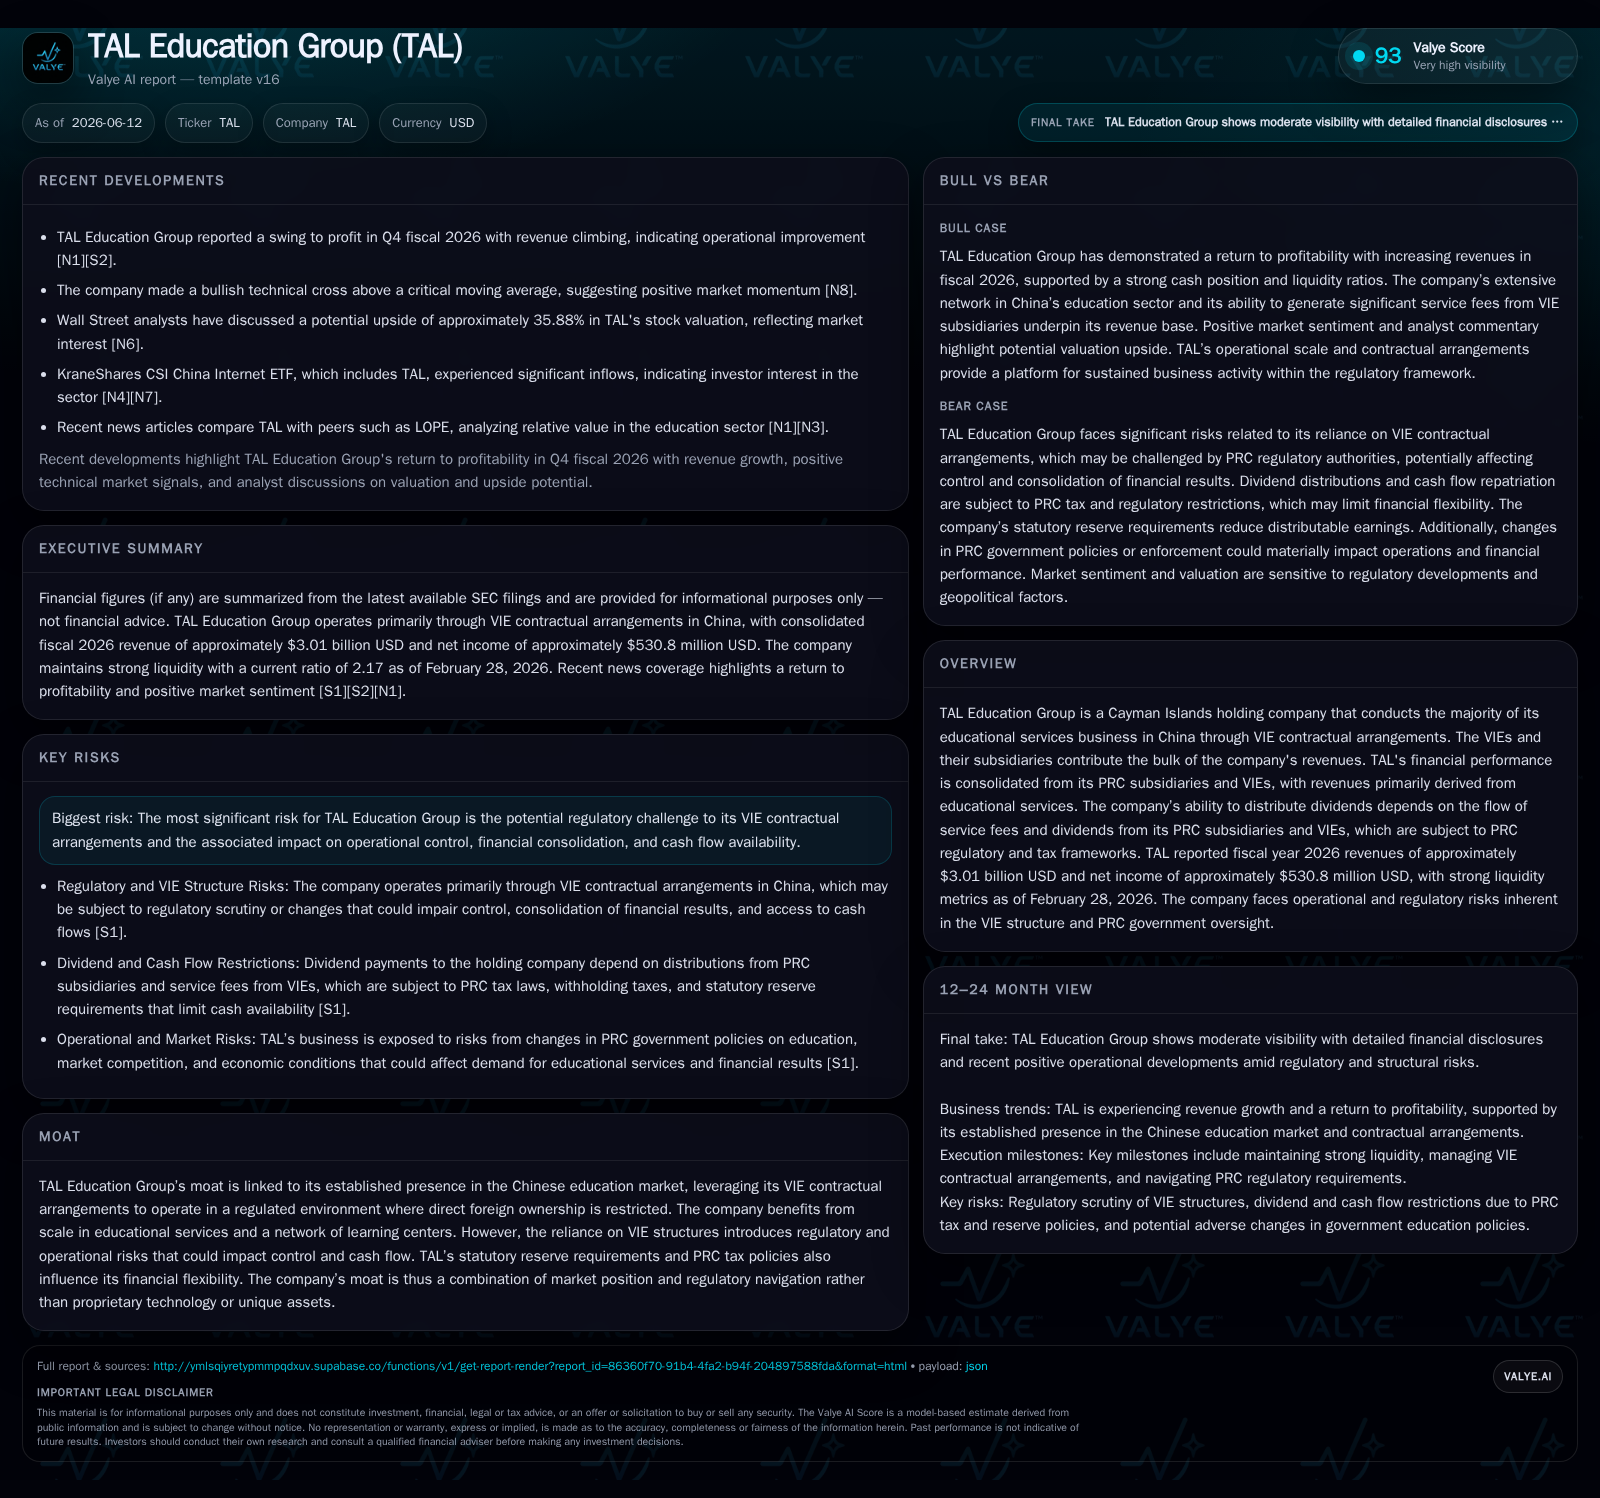
TAL Education Group's latest fiscal year results show revenue of roughly $3.01 billion and net income exceeding $530 million, supported by a strong current ratio of 2.17 and robust cash reserves. The company remains heavily reliant on its VIE contractual arrangements in China, which account for nearly 79% of revenues, underscoring ongoing regulatory risk exposure. Operationally, TAL balances traditional offline learning centers with expanding online platforms, driving student enrollment and retention improvements amid market challenges. Near-term growth hinges on managing regulatory compliance, optimizing hybrid delivery models, and careful capital deployment between physical and digital investments.
Latest Operating Update Reflecting Fiscal Q4 and FY2026 Results
Corporate Structure: The Role and Risks of VIE Contractual Arrangements
TAL Education operates as a Cayman Islands holding entity without direct business operations; its core educational services are delivered through PRC subsidiaries and variable interest entities (VIEs) established under contractual arrangements due to Chinese restrictions on foreign ownership in education [S1][S6]. In FY2026, the VIEs accounted for about 78.6% of total net revenues — slightly down from prior years but still constituting the bulk of TAL's top-line [S1][S6].
Such reliance on VIE structures enables TAL to retain effective operational control in China but simultaneously exposes the company to inherent risks relating to potential regulatory scrutiny or governmental disapproval that could disrupt consolidation or cash flow extraction [S1]. Dividends payable by PRC subsidiaries to the holding company depend largely on service fees received from the VIEs — these fees soared to $1.03 billion in FY2026 up from approximately $170 million in FY2025 — demonstrating tight intercompany cash flow dependencies required to support shareholder returns and debt servicing capacity [S1][S6].
While TAL has utilized multinational enterprise cross-border RMB fund pools to optimize internal financing flows amid these regulations, any future restrictions could constrain capital mobility and financial flexibility within the group [S1]. This complex corporate governance dynamic remains a key watchpoint.
Revenue Composition: Balancing Offline Learning Centers with Online Platforms
TAL generates revenues primarily from tutoring services delivered through a hybrid model encompassing both traditional offline learning centers across various Chinese cities and increasingly prominent online education platforms [S1][S2].
Physical learning centers carry significant operating leverage due to fixed lease property management fees ($20.4 million annually) and capital expenditure commitments (~$21.2 million relating mainly to office space construction) [S20], demanding consistent student enrollment levels for margin sustainability.
Simultaneously, TAL has expanded investment into digital infrastructure enabling broader accessibility via online platforms engaging active users growing steadily per recent updates [S2]. This diversification distributes revenue concentration risks while catering to evolving customer preferences favoring technology-enabled personalized learning solutions.
The progression toward blended learning forms part of TAL’s strategic response to demographic shifts and changes in Chinese education policy post the government's pronounced curbs on excessive tutoring activities.
Industry Competitive Context and Peer Comparisons Within China’s Tutoring Sector
Within China's education services industry—characterized by highly regulated market entry conditions—TAL's scale ranks it among prominent players like New Oriental Education & Technology Group while differentiating itself through sustained adaptation to stringent regulatory frameworks governing VIE use [S1].
Compared with Gaotu Techedu—a peer more focused on pure online education platforms—TAL maintains a balanced footprint across both offline venues and digital channels, positioning it advantageously amid shifting consumer demands.
On margin fronts relative to U.S.-based blended education peers such as K12 Inc., TAL contends with heightened operating expenses tied to physical center upkeep yet leverages its broad network for customer acquisition efficiencies.
Growth Drivers: Enrollment Trends, Hybrid Delivery Expansion, and Market Tailwinds
The post-regulatory tightening environment has catalyzed renewed demand for supplemental tutoring among Chinese students seeking academic competitiveness, underpinning improvements in TAL’s reported student enrollment numbers following prior declines caused by policy uncertainty [S2][S1]
Digital transformation efforts have increased online platform active users, extending reach beyond urban clusters served by physical centers; this channel supports scalable incremental revenue growth at lower marginal cost compared with brick-and-mortar expansion.
Technological advancements enabling curriculum customization further enhance retention rates by improving perceived educational outcomes—critical given elevated customer acquisition costs (CAC) specifically associated with tutoring services where switching costs are moderate yet engagement depends heavily on demonstrated efficacy.
Dividend accessibility is intrinsically linked to adequate service fee flow from VIE subsidiaries; any disruptions here would constrain TAL’s ability to service external debt or return capital despite underlying profitability.
Additionally, the company's fixed-cost-heavy offline learning center network introduces operating leverage vulnerabilities; fluctuations in student enrollment due to demographic trends or economic cycles can significantly pressure margins if utilization rates decline abruptly.
Customer acquisition cost inflation combined with churn risks—especially in an environment of policy uncertainty—could further compress profitability should TAL be unable to maintain robust retention metrics.
What To Watch Next: Milestones in Regulatory Compliance and Operational KPIs
Key upcoming milestones include monitoring official statements regarding compliance with evolving PRC regulations affecting VIE structures alongside disclosures around dividend repatriation trends.
Operationally, sequential quarterly reports detailing student enrollment metrics across offline centers versus online platform active user growth will inform sustainability of recent positive trends.
Management commentary or strategic moves toward further digital capability investment versus traditional geographic expansion will provide signals on capital allocation priorities amid market stabilization efforts.
Investor community attention will remain focused on legal outcomes related to ongoing class action settlement fairness hearings scheduled in late 2026 which bear reputational implications.
Financial Profile Overview: Liquidity, Profitability, and Capital Commitments
Despite structural cash flow constraints imposed by inter-entity dividend limitations inherent in the VIE model, operating income margins remain positive at circa 9%, reflecting disciplined cost management amid fluctuating top-line pressures.
Capital expenditures remain concentrated on augmenting office infrastructure supporting blended delivery rather than aggressive physical center expansions—a prudent move considering uncertain demand cycles impacting fixed asset utilization [S20]
Ongoing share repurchase authorizations totaling up to $600 million indicate management confidence in long-term value creation amid navigating near-term external challenges [S16]
Disclaimer: This analysis is based solely on information disclosed through the latest SEC filings referenced herein. It does not constitute investment advice or an endorsement but aims to provide a detailed operational review rooted strictly in documented evidence specific to TAL Education Group’s current business context.
Financial position in context
As of 2026-02-28, companyfacts shows $1.52 billion in cash and equivalents [F1]. Current assets of $3.84 billion and current liabilities of $1.77 billion imply a current ratio near 2.17x for 2026-02-28 [F1].
Disclaimer: This is research-only, informational analysis and not investment advice. It may include AI-generated interpretation and general industry context. Always verify important details using primary sources.
Comments