
ThredUp’s Transformation: From Operating Losses to Growth Levers in Online Apparel Resale
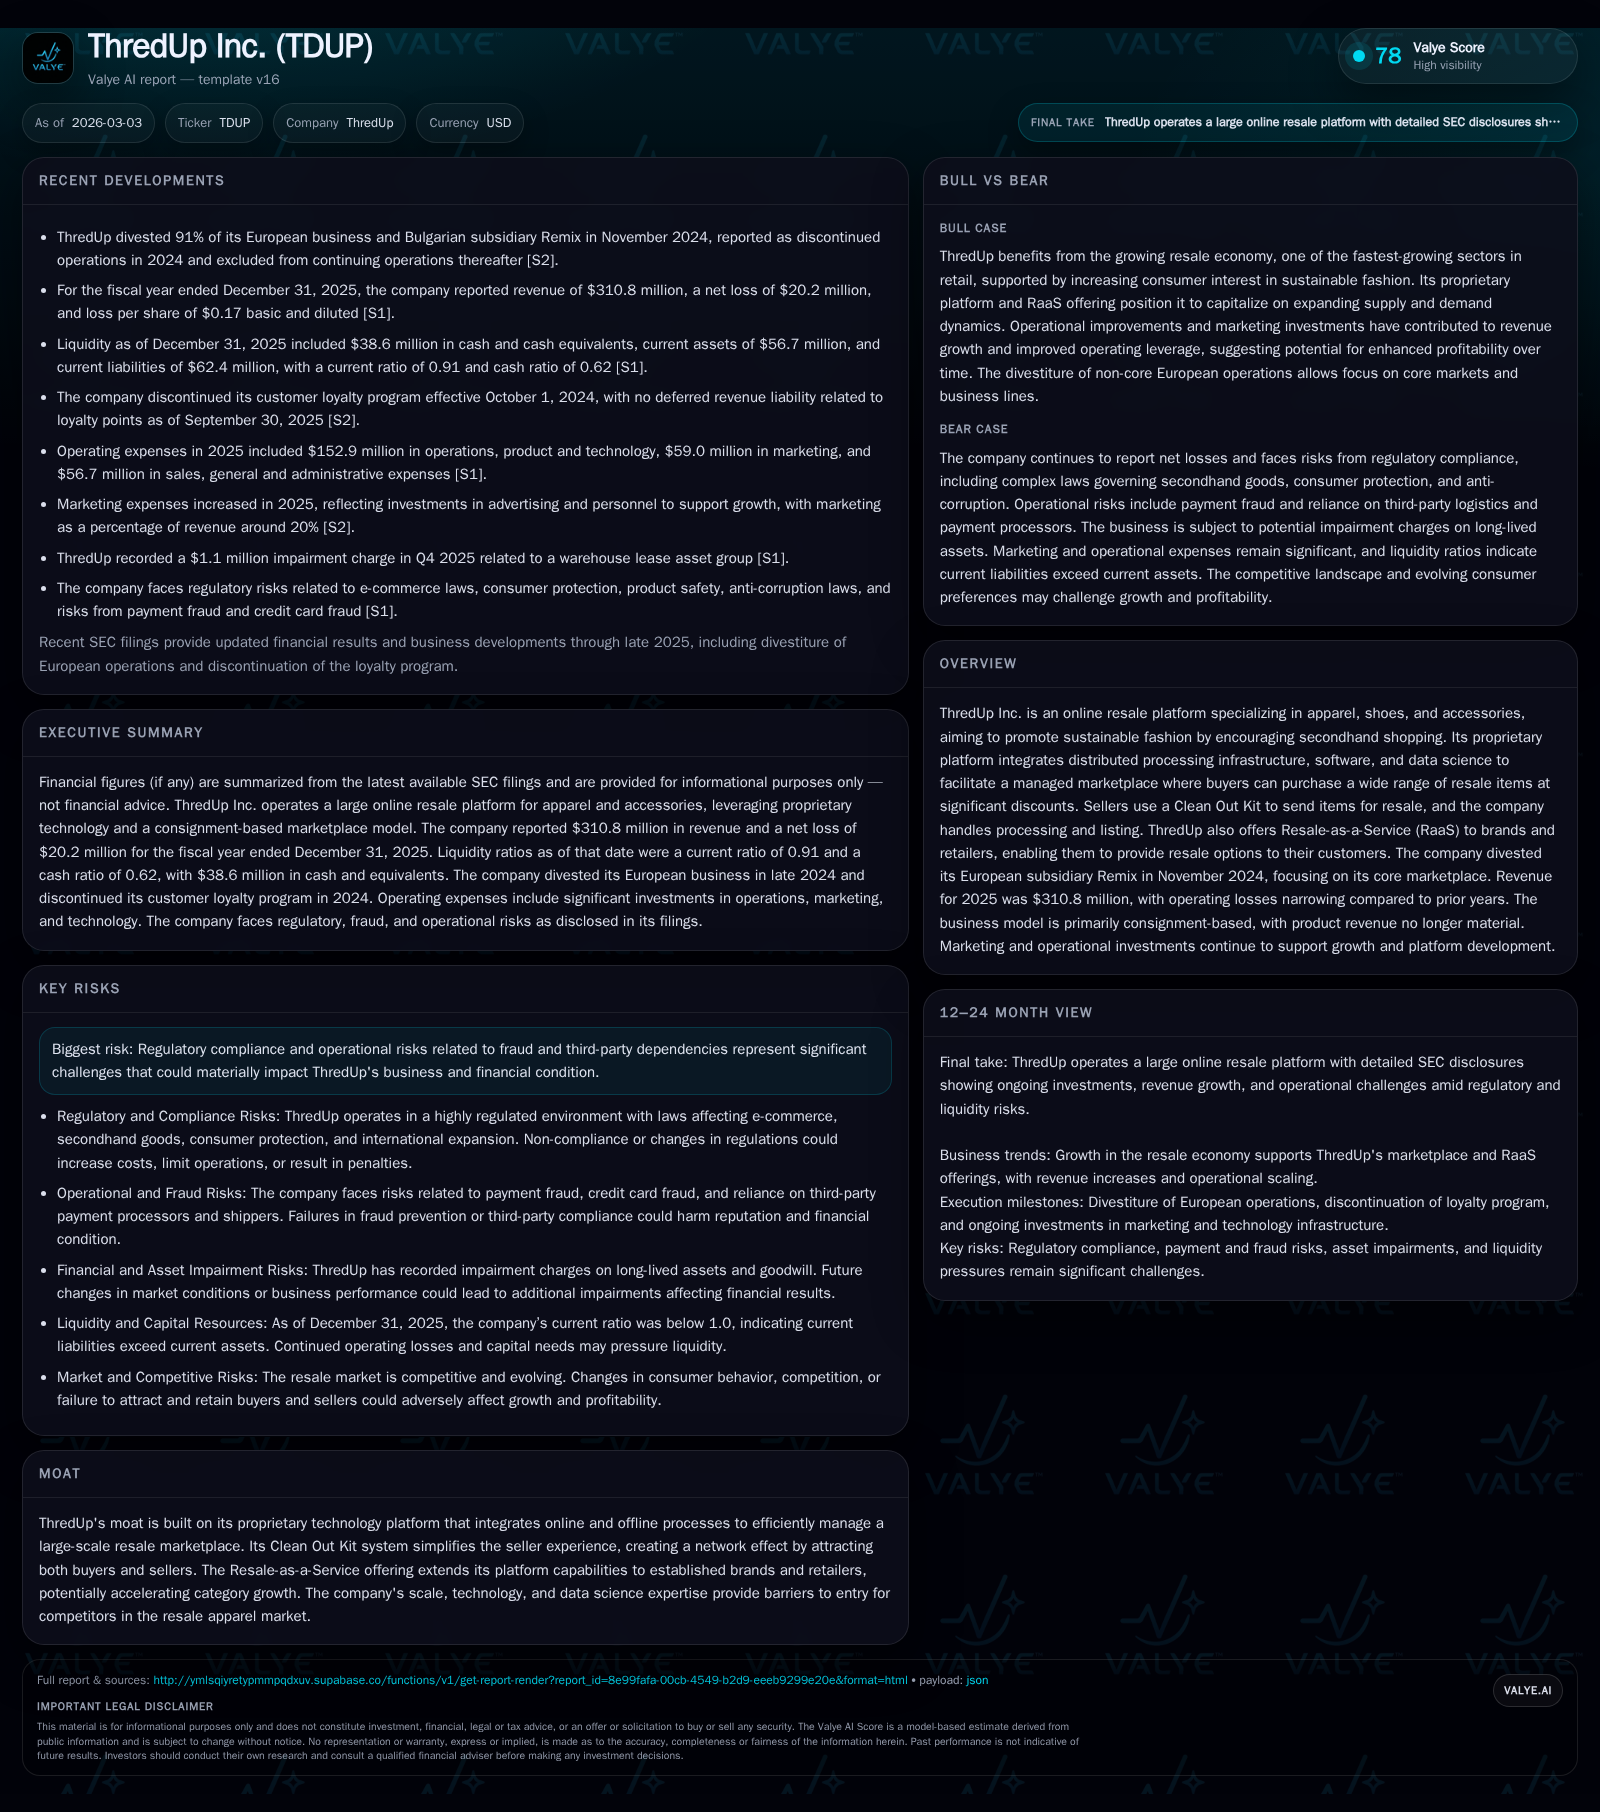
ThredUp is narrowing operating losses through a focused consignment model and proprietary platform while managing capital constraints amid industry and regulatory headwinds.
ThredUp Inc. has reduced its operating losses substantially over the past three years by pivoting towards a capital-efficient consignment marketplace enabled by its proprietary technology. The divestiture of its European subsidiary in late 2024 refocused resources on its core U.S. operations, contributing to improved unit economics and gross margin expansion. Yet, regulatory compliance demands and restrictive debt covenants impose operational and capital allocation constraints that cloud visibility on future growth and profitability milestones. Investors should monitor RaaS customer traction, margin trajectories, and liquidity amidst rising interest costs under recently amended loan agreements.
Historical Financial Performance: Shrinking Losses and Key Drivers
ThredUp Inc.'s financial evolution over recent years demonstrates a marked contraction in operating losses accompanied by measured revenue growth. Operating income improved from a -$89.5 million loss in FY 2022 to a -$21.7 million loss by FY 2025, representing about a 46.5% reduction year-over-year between 2024 and 2025 [F1]. This turnaround highlights efficiency gains primarily stemming from an enhanced gross margin profile and prudent cost controls across operations.
Revenue reached an estimated $310.8 million in 2025 as per company disclosures , supporting higher operating leverage particularly within its capital-efficient consignment model. Net income mirrored this improvement trajectory albeit remaining negative at approximately -$20.2 million for the same period [F1], indicative of ongoing investments for scalable growth.
Operating cash flow showed recoveries from deeper negative territory (-$52.1 million in 2022) toward less severe outflows (-$22.6 million reported for FY 2023), yet free cash flow remains pressurized by sustained capital expenditures focused on distribution automation ($10.5 million capex recorded in FY 2025) [F1]. This capex investment reflects the company's effort to structurally reduce inbound shipping costs and improve fulfillment efficiency noted as margin drivers elsewhere [S4].
Historical performance (annual)
| FY | Net ($mm) | CFO ($mm) | OpInc ($mm) | Capex ($mm) | Net YoY |
|---|---|---|---|---|---|
| 2025 | -20 | -22 | 10 | +73.7% | |
| 2024 | -77 | -41 | 7 | -8.1% | |
| 2023 | -71 | -23 | -72 | 16 | +22.8% |
| 2022 | -92 | -52 | -89 | 43 |
Source: SEC companyfacts cache [F1].
Capital returns and efficiency (annual)
| FY | FCF ($mm) | ROE% |
|---|---|---|
| 2025 | -34.1 | |
| 2024 | -136.7 | |
| 2023 | -39 | -68.6 |
| 2022 | -95 | -65.9 |
Source: SEC companyfacts cache [F1].
*Revenue approximated from public disclosures; other figures cited from [F1].
Gross margin expansion of roughly seventy basis points was reported for mid-2025 periods compared to the prior year, driven by lower cost of goods relative to revenue — a function of higher capital efficiency in consignment versus direct product sales [S4]. Operational expenses scaled moderately but benefited from improved operating leverage derived from enhanced supply chain automation.
Streamlining the Marketplace: Divestiture Impacts and Model Shift
In November 2024, ThredUp's divestiture of its European operation Remix marked a strategic retreat designed to concentrate resources on the core U.S resale marketplace [N1]. The move correlates directly with shifting business economics away from lower-margin owned inventory sales toward primarily consignment-based revenues enhanced by their RaaS platform.
This reorientation aligns with company statements emphasizing heightened unit economics through reduced working capital intensity and asset-light scaling paths inherent in consignment models . It also signals a strategy favoring partnership-enabled resale integration for brand partners over vertically integrated product sales that demand heavier capital commitments.
Operationally, this narrowing allows sharper focus on expanding active buyer counts and increasing orders within a tightly managed marketplace ecosystem — factors driving topline momentum while optimizing fulfillment throughput efficiency.
The consequent reduction in losses since divestiture underscores unit-level improvements related to lower sales discounts needed for inventory held outright and quicker inventory turns via consignment streams.
Technology and Platform Moat: Proprietary Systems Driving Network Effects
ThredUp's competitive moat is anchored on its sophisticated technology platform integrating offline sorting processes with online marketplace operations — an architecture that underpins their managed marketplace liquidity.
Key is the Clean Out Kit system which simplifies the seller onboarding experience: sellers send items in prepaid bags that ThredUp processes centrally, automating quality validation and listing workflows . This operational feature drives scale economies by enabling rapid seller participation while maintaining consistent inventory quality standards, fostering network effects where more sellers attract more buyers and vice versa.
Additionally, the company invests heavily in distributed processing infrastructure alongside data science capabilities that optimize pricing algorithms, inventory assortments, and supply predictions . These capabilities reinforce platform stickiness against new entrants who face high upfront costs for developing comparable infrastructure.
The introduction of Resale-as-a-Service (RaaS) further differentiates ThredUp by extending these platform capabilities as white-label solutions enabling brands or retailers seeking resale options without building internal expertise — effectively expanding technological barriers within apparel resale ecosystems.
Growth Outlook: Opportunities and Operational Challenges Ahead
ThredUp’s forward trajectory leverages broader adoption of secondhand apparel paired with RaaS-driven category growth potential [N1]. The company anticipates increased order volumes fueled by growth in active buyers attracted through targeted marketing efforts balanced against expanding reseller participation improving supply-side liquidity.
However, regulatory risks loom large as detailed extensively in SEC filings including data privacy laws, online commerce advertising restrictions, anti-fraud measures, antitrust scrutiny, and e-commerce jurisdictional limits [S1]. These regulations could elevate compliance costs or constrain permissible marketing tactics impacting customer acquisition efficiency.
Further uncertainty arises from third-party dependencies such as logistics providers critical for distributed processing which may pose operational risks if disrupted . Moreover, given the highly competitive landscape with emerging resale platforms entering aggressively, sustaining market share gains rests heavily on execution excellence.
Capital Structure and Liquidity: Navigating Debt Covenants and Cash Flow Constraints
ThredUp’s debt facility comprises a term loan initially arranged for $40 million escalated through amendments allowing drawdowns up to ~$48.8 million earmarked largely for equipment purchases supporting automation initiatives [S5][S6][S7][S8]. As of December 31, 2025, $18.3 million was outstanding with $22.5 million undrawn but available under prior terms; recent January 2026 amendments reduced available borrowings under commitment to $10 million [S6].
Significantly, interest expense transitioned from prime-rate-based pricing capped at a floor of 4.75% plus margin to SOFR-linked rates with a floor at 2.50%, but combined with a higher margin raise effective borrowing costs amid volatile rate environments elevating finance charges risk [S6]. Current effective rates hovered near ~8% by year-end reflecting these dynamics.
The loan agreement imposes financial covenants including liquidity thresholds monitored daily alongside restrictions curtailing dividend payments or share repurchases — constraining returning cash to shareholders despite growing cash balances reaching $38.6 million at end-2025 [F1][S25][S26]. Failure to maintain covenants risks default triggering acceleration of debt repayment obligations backed by lien claims on substantially all corporate assets.
Liquidity projections foresee adequate coverage for next twelve months driven by operating cash flows supplemented by available credit lines; however fulfilling longer-term plans hinges on managing covenant thresholds closely especially given fixed amortization schedules into mid-2027 now extended subject to term amendments [S7][S27].
What to Watch: Milestones and Execution Risks for Investors
Absent explicit public financial forecasts beyond traction commentary during earnings calls [N1], stakeholders should focus on several key execution touchpoints:
- Consistent quarter-on-quarter revenue inflections signaling accelerating active buyer growth;
- Improvement or stability in gross margin percentages post-remix divestment confirming healthier unit economics;
- Expansion pace of RaaS client additions evidencing broader market acceptance;
- Regulatory environment developments impacting promotional strategies or requiring costly adjustments;
- Compliance track record maintaining debt covenant adherence ensuring uninterrupted access to funding sources.
Emerging competitive entrants combined with stringent regulatory constraints heighten execution risk profiles underscoring importance of agile operational adjustments alongside measured marketing investments.
Return Profile: Evaluating ROE, Cash Flows, and Capital Allocation Choices
Reflecting continued net losses totaling approximately -$20 million in FY 2025 against total equity near $59 million yields a negative return on equity metric around -34%, consistent with companies prioritizing scalable business model execution over short-term profitability [F1].
Free cash flow remains negative around -$33 million when combining operating cash flows (approximately positive but insufficient alone) netted against steady capital expenditures primarily directed towards distribution automation projects [F1][S26]. Capital expenditure fluctuations reflect staged investment cycles rather than expansion accelerations given near-term pause on new marketplaces location rollouts mentioned publicly [N1][S25].
Dividend payments or stock repurchase programs are presently precluded due to credit agreements restricting discretionary cash deployments until sustainable profitability metrics improve significantly [S26]. Therefore, capital allocation discipline favors reinvestment into operational enhancements supporting longer-term growth pathways rather than shareholder returns.
This analysis is based solely on publicly available information including SEC filings and corporate disclosures without extrapolations or speculative forecasts beyond stated facts. It illustrates ThredUp’s path toward balancing transformational growth initiatives against financial discipline within evolving market conditions accompanied by meaningful operational risks particularly relating to regulatory requirements and liquidity management.
Disclaimer: This is research-only, informational analysis and not investment advice. It may include AI-generated interpretation and general industry context. Always verify important details using primary sources.
Comments