
Teledyne Technologies Strengthens Profitability and Incentive Alignment in Q1 2026
Q1 2026 results reveal solid earnings growth supported by strategic acquisitions and enhanced executive incentives.
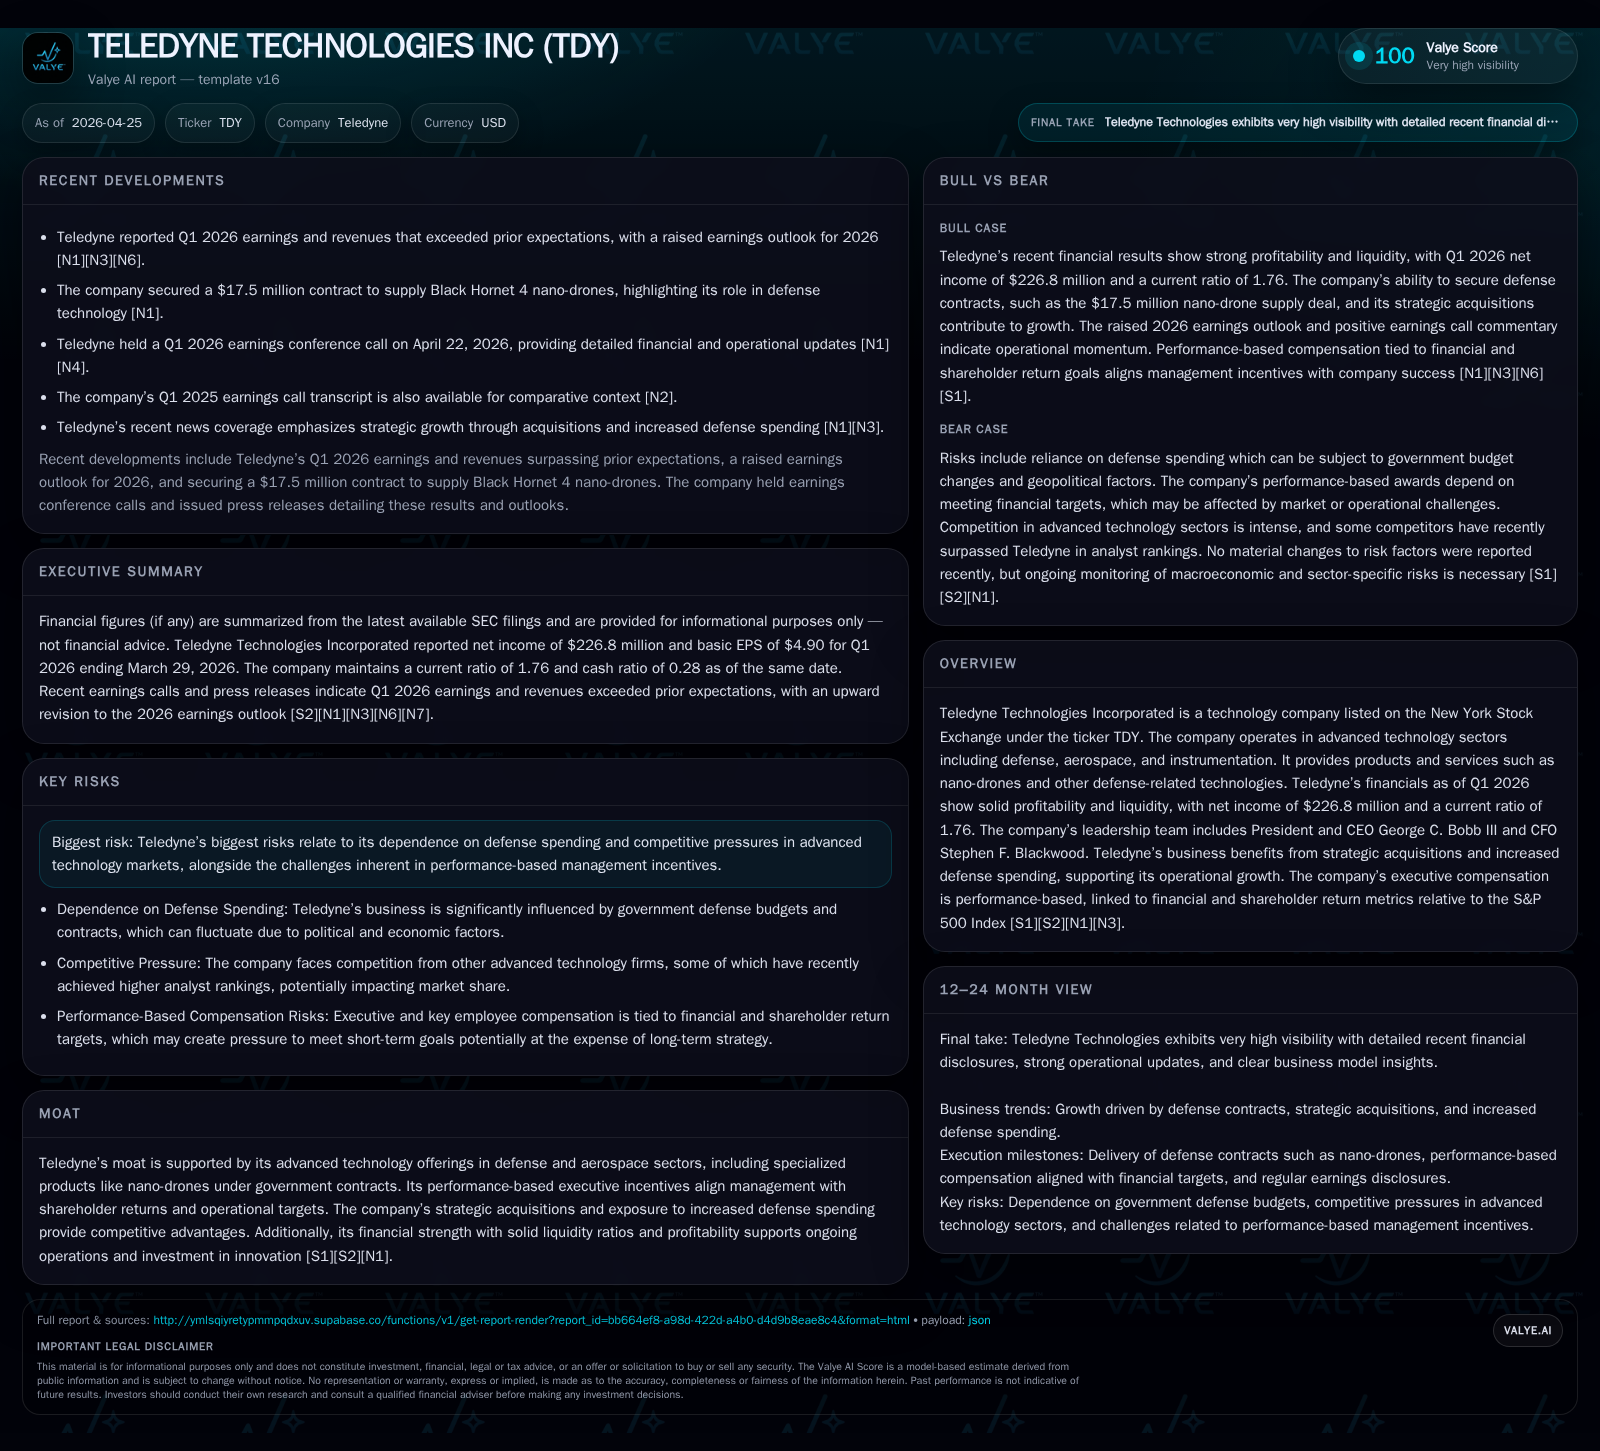
Teledyne Technologies Inc reported a commendable first-quarter operating performance, marked by net income of $226.8 million and a stable liquidity profile with a current ratio of 1.76. The company reinforced shareholder alignment through amendments to its incentive award plans, extending the term and increasing share availability. Teledyne’s business model leverages advanced technology in defense, aerospace, and instrumentation sectors, bolstered by robust demand for nano-drones and other defense-related technologies under government contracts. Key growth drivers include ongoing defense spending increases and targeted acquisitions, while execution risks stem from dependence on defense budgets and competitive market pressures.
Recent Operating Update
Teledyne Technologies Incorporated's latest quarterly filing (Form 10-Q dated April 24, 2026) presents a continuation of solid operating momentum into Q1 2026. The company reported net income of approximately $226.8 million for the quarter as per commentary from earnings call transcripts [N1]. This builds on annual profit trends supported by efficient operations within its core advanced technology segments focused on defense, aerospace, and instrumentation [S2]. Liquidity remains healthy with a current ratio of 1.76 based on current assets of $3.32 billion against current liabilities of $1.89 billion as reported at the end of March 2026 [F1].
Additionally, a pivotal corporate governance update emerged just prior to the quarterly disclosure. At the Annual Meeting in April 2026, Teledyne’s stockholders approved an amended and restated version of its 2014 Incentive Award Plan [S3], which notably extends the plan’s term through 2036 and increases share availability by four million shares—a strategic move to retain top talent during an intensified competition for executives in technology sectors.
Business Model
Teledyne's revenue derives from supplying technologically advanced products and services to clientele predominantly within government defense contracts alongside commercial aerospace and precision instrumentation markets [S1]. Its offerings include cutting-edge components such as nano-drones—an increasingly relevant product due to rising defense operational needs—as well as instrumentation systems integral to monitoring, imaging, and data analytics.
Revenue streams are diversified across multiple high-technology applications but remain heavily reliant on U.S. government spending patterns, particularly defense procurement cycles [S4][S5]. The company generates recurring revenues through long-term contracts complemented by aftermarket services that add robustness against cyclical downturns.
Executive leadership underscores performance alignment through the calibration of incentives tied both to financial metrics (operating profit, revenue growth) and shareholder returns measured against the S&P 500 benchmark over rolling three-year periods [S9][S11][S17]. This structure ensures management is incentivized for both profitability and market performance — a rationale embedded in the recently enhanced restricted stock unit awards.
Industry Structure & Competitive Position
Operating at the intersection of defense technology, aerospace components, and scientific instrumentation, Teledyne inhabits a complex industry value chain marked by significant R&D investments, stringent regulatory compliance requirements, and high barriers to entry due to technical expertise.
Competition includes traditional aerospace contractors but also emerging tech firms introducing innovations like autonomous systems—nano-drones being a case in point. Teledyne’s appeal lies in its integrated platform approach combining hardware innovation with software-enabled capabilities tailored for mission-critical applications [N9].
Its moat is reinforced through government contract relationships that provide steady revenue visibility and substantial switching costs related to certification processes and integration within client systems. Strategic acquisitions have been instrumental in maintaining technological edge and broadening product scope.
Growth Drivers & Constraints
Growth hinges structurally on escalating national defense budgets particularly allocated for modernizing military capabilities—including unmanned systems—and expanding aerospace safety/navigational technologies. Increased global geopolitical tensions incrementally elevate that demand.
Complementing organic growth are targeted acquisitions aimed at supplementing internal innovation pipelines while accelerating entry into emerging subsegments like cyber-physical systems or advanced sensing solutions [N9]. These moves increase cross-selling opportunities across Teledyne’s broad customer base.
Conversely, dependence on federal funding introduces cyclicality risk if political or fiscal conditions prompt budget reductions. Competitor innovations impose continuous pressure necessitating sustained investment into R&D.
Executive compensation frameworks revealing performance-based vesting create additional operational rigor but could also constrain managerial flexibility if targets set prove overly ambitious amid uncertain macro conditions.
What to Watch Next
Key near-term indicators include the successful integration outcomes of recent acquisitions disclosed in recent quarters—success here will determine if growth projections materialize. Monitoring defense contract awards published periodically will provide directional clues on demand stability.
Operational cadence around meeting or exceeding guidance embedded within amended incentive compensation plans will be telling around management’s confidence level.
Subsequent quarterly disclosures may also shed light on any emerging supply chain constraints or cost inflation effects given ongoing global macro volatility.
Financial Profile
Historical performance (annual)
|
| FY | Net ($mm) | CFO ($mm) | OpInc ($mm) | Capex ($mm) | Net YoY |
|---|---|---|---|---|---|
| 2025 | 895 | 1191 | 1150 | 117 | +9.2% |
| 2024 | 819 | 1192 | 989 | 84 | -7.5% |
| 2023 | 886 | 836 | 1034 | 115 | +12.3% |
| 2022 | 789 | 487 | 972 | 93 |
Source: SEC companyfacts cache [F1].
Capital returns and efficiency (annual)
|
| FY | Buybacks ($mm) | FCF ($mm) | ROE% |
|---|---|---|---|
| 2025 | 403 | 1074 | 8.5 |
| 2024 | 354 | 1108 | 8.6 |
| 2023 | 721 | 9.6 | |
| 2022 | 394 | 9.7 |
Source: SEC companyfacts cache [F1].
Supporting its operational strategy is Teledyne’s robust financial framework: FY2025 operating income grew by over 16% year-over-year reaching approximately $1.15 billion while net income rose about 9% year-over-year to nearly $895 million [F1]. Operating cash flow remains strong at about $1.19 billion offsetting capex spend of $117 million resulting in free cash flow slightly over $1 billion annually.
The capital structure shows a total debt figure near $2.49 billion (year-end December 2025), partially offset by cash reserves of approximately $521 million as of March 2026 quarter-end leading to net debt just under $2 billion [F1]. The leverage profile is consistent with sector norms.
For capital allocation priorities, Teledyne returned significant value to shareholders via buybacks totaling approximately $403 million during FY2025 coupled with regular dividend payments [F1], indicating healthy liquidity management balanced against reinvestment needs.
Management pay adjustments effective early FY2026 indicate a drive toward retaining talent aligned with long-term goals; CEO George C. Bobb III’s total direct compensation emphasizes base salary plus eligibility for stock options and performance-restricted unit grants representing high alignment with investor outcomes [S16][S17][S26].
This analysis synthesizes publicly disclosed SEC filings, earnings call transcripts, and available company financial data as of April 2026 without providing investment advice or recommendations.
Disclaimer: This is research-only, informational analysis and not investment advice. It may include AI-generated interpretation and general industry context. Always verify important details using primary sources.
Comments