
Hanover Insurance Group Accelerates Profitability Through Diversified Lines and Disciplined Capital Strategy
A review of Hanover’s revenue growth, underwriting performance, and shareholder return focus amid sector challenges.
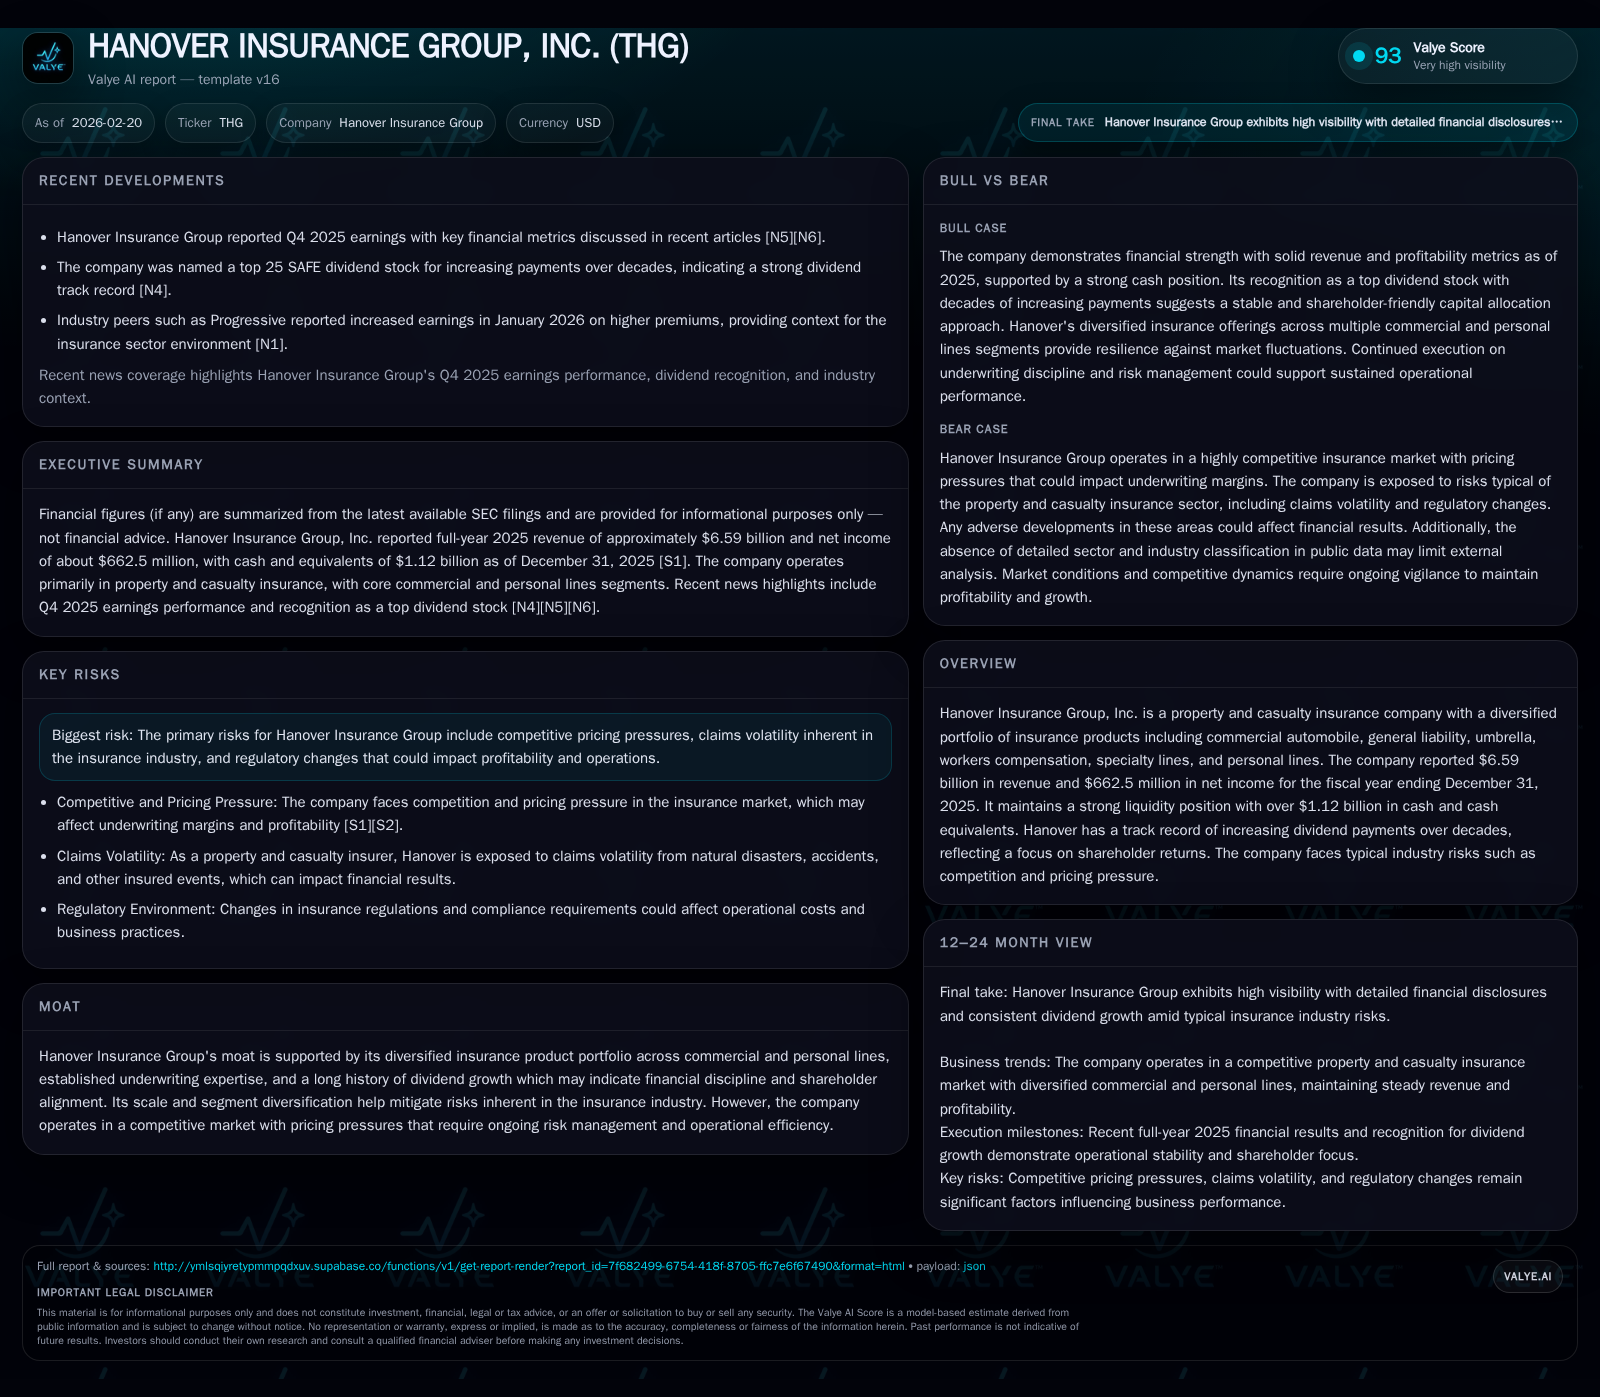
Hanover Insurance Group reported robust financial performance in fiscal 2025, driven by diversified product segments and disciplined underwriting, leading to a 5.7% revenue increase and a notable 43.5% surge in operating income year-over-year. The company demonstrated strong capital management with an 18.5% approximate ROE, supported by growing dividends and increased share repurchases. Despite facing pricing pressures common in the property and casualty insurance industry, Hanover maintains a substantial liquidity buffer that underpins operational flexibility. Investors should monitor upcoming combined ratio trends and claims experience as key indicators for sustained profitability.
Steady Revenue Growth Fueled by Diverse Insurance Segments
Hanover Insurance Group has exhibited a consistent upward trend in revenues from fiscal year (FY) 2022 through FY2025, culminating in $6.59 billion in total revenues for the most recent year ended December 31, 2025 [F1]. This represents a year-over-year (YoY) growth rate of approximately 5.7%, extending a multi-year period of revenue expansion that began with $5.47 billion in FY2022 and steadily climbed each subsequent year.
The company’s diversified portfolio—including commercial automobile, general liability, umbrella policies, workers compensation, specialty lines, and personal lines—plays a central role in mitigating the concentration risk typical of single-segment insurers. Such diversification aligns well with the industry's reliance on short-duration contracts allowing quick repricing amid changing loss expectations or market conditions (analysis). Commercial multiple peril (CMP) lines remain vital contributors given their flexible underwriting dynamics.
This segment spread allows Hanover to balance exposure across products where loss trends and regulatory pressures can vary significantly—workers' compensation often faces regulatory wage base shifts while specialty lines entail distinct risk pool behaviors [S1].
Historical performance (annual)
| FY | Rev ($bn) | Net ($mm) | CFO ($mm) | OpInc ($mm) | Rev YoY | Net YoY |
|---|---|---|---|---|---|---|
| 2025 | 6.6 | 663 | 1178 | 933 | +5.7% | +55.5% |
| 2024 | 6.2 | 426 | 806 | 650 | +4.1% | +1106.8% |
| 2023 | 6.0 | 35 | 362 | 106 | +9.6% | -69.6% |
| 2022 | 5.5 | 116 | 722 | 285 |
Note: Omitted columns lack sufficient annual XBRL coverage in the provided tags (need ≥2 annual points): Capex. Source: SEC companyfacts cache [F1].
Capital returns and efficiency (annual)
| FY | Div ($mm) | Buybacks ($mm) | FCF ($mm) |
|---|---|---|---|
| 2025 | 131 | 129 | 1170 |
| 2024 | 124 | 27 | 796 |
| 2023 | 117 | 31 | 350 |
| 2022 | 109 | 31 | 705 |
Source: SEC companyfacts cache [F1].
Note: Operating Income, Net Income, Cash Flows shown further below.
Operating Income Expansion Reflects Underwriting and Investment Gains
Operating income—inclusive of both underwriting results and net investment income—advanced dramatically by roughly 43.5% YoY to reach $933 million in FY2025 [F1]. This leap reflects Hanover's enhanced underwriting margin management in a competitive P&C market scenario characterized by pricing pressure challenges [N14]. Q4 earnings commentary reiterated effective loss ratio controls paired with disciplined expense management [N3].
Such gains are notable given industry headwinds where claims frequency and severity can erode margins rapidly without timely premium increases or portfolio shifts (analysis). Hanover benefits from prudent reserving practices and reinsurance coverage calibrated to limit volatility on its core commercial lines book ([S9]).
Recent Earnings Beat Full-Year Estimates
Hanover’s Q4 2025 earnings notably exceeded analyst estimates, with net income climbing approximately 55.5% from prior-year levels to $662.5 million for the full year [N2][N3][F1]. This beat was driven by stronger earned premiums coupled with favorable loss experiences versus expectations [N9].
The positive surprise underscores tight control over claims frequency/severity drivers—a critical differentiator especially amid increasingly volatile catastrophe exposures affecting the broader industry ([S14]). Commentary also highlighted improved underwriting leverage which partially offset ongoing premium rate competition challenges faced across the P&C space.
Industry Headwinds: Pricing Pressure and Claims Volatility
Hanover operates within an environment marked by fierce price competition among carriers seeking market share gains post-soft market cycles [S9]. This dynamic exerts direct pressure on 'pricing adequacy'—the insurer's ability to cover expected losses plus expenses fully at present premium levels.
Additionally, claims volatility remains elevated owing to climate-related catastrophes and unpredictable injury or liability trends that could strain reserve adequacy if not sufficiently anticipated ([S14]). Regulatory environments continue evolving across states impacting product design, capital requirements, and reserve methodologies—all posing operational risks that require ongoing monitoring.
Robust Liquidity & Capital Structure Supporting Strategic Flexibility
Hanover’s balance sheet strength is evident with over $1.12 billion in cash and equivalents as of the end of FY2025 [F1], providing a significant liquidity buffer against claim surges or business opportunities requiring rapid capital deployment.
The company benefits from solid credit ratings including Moody's Aa3 classification afforded partly due to its asset quality alignment—investment-grade corporate bonds, municipal securities, along with prudent diversification across fixed maturities ([S6],[S7]). Such credit strength underpins favorable reinsurance arrangements essential for risk mitigation within commercial lines underwriting.
Disciplined Capital Deployment: Dividends, Buybacks & ROE Trends
Return on equity reached an attractive approximate level of 18.5%, calculated as net income ($662.5 million) divided by ending equity ($3.57 billion) for FY2025 [F1]. This reflects high capital efficiency amid disciplined risk retention.
Shareholder returns remain central; dividends paid rose to $130.6 million in FY2025 from prior years' steady increases [F1][N12]. Additionally, share repurchases accelerated sharply to $129.2 million from about $27 million the previous year [F1], signaling active capital redeployment aligned with confidence in intrinsic value preservation.
Operating cash flow also demonstrated strength at $1.18 billion for FY2025 [F1], generating robust free cash flow after modest capital expenditures totaling $7.7 million, down from previous years.
| Fiscal Year | Operating Income (USD millions) | Net Income (USD millions) | Operating Cash Flow (USD millions) | Dividends Paid (USD millions) | Share Repurchases (USD millions) |
|---|---|---|---|---|---|
| FY2022 | 285 | 116 | 722 | 109 | 31 |
| FY2023 | 106 | 35 | 362 | 117 | 31 |
| FY2024 | 650 | 426 | 806 | 124 | 27 |
| FY2025 | 933 | 663 | 1178 | 131 | 129 |
Note: All figures sourced from SEC filings [F1].
Key Risks & Regulatory Considerations Impacting Outlook
Principal risks include competitive pricing pressures potentially compressing underwriting margins absent offsetting expense or investment gains ([S9]). Elevated claims volatility related to catastrophe frequency/intensity or emerging liability exposures could impact loss ratios unexpectedly ([S14]). Regulatory changes such as evolving insurance laws or reserving standards may increase compliance burdens or constrain product flexibility.
These factors underscore the importance of monitoring actuarial assumptions embedded within reserves alongside pricing agility responding to rapid market developments.
Market Metrics & Forward-Looking Indicators
Investors should focus on Hanover’s combined ratio metrics as key indicators of operational health—tracking whether loss plus expense ratios move above or below breakeven thresholds.
Premium rate trends will provide insight into competitive positioning effectiveness while investments in underwriting technology or claims analytics may offer margin expansion through improved risk selection or claims handling efficiencies.
Comparative peers such as Progressive highlight industry-wide premium increases but direct comparability depends on differing portfolios ([N1]).
This analysis is based exclusively on publicly available data including SEC filings [F1], recent news releases [N#], and regulatory disclosures [S#] as of February 20, 2026. It does not constitute investment advice.
Disclaimer: This is research-only, informational analysis and not investment advice. It may include AI-generated interpretation and general industry context. Always verify important details using primary sources.
Comments