
Ryerson Holding Faces Margin Pressure as Olympic Steel Merger Reshapes Metals Distribution
Ryerson Holding's full-year 2025 reflects narrowed margins and a widened loss amid volatile metal prices and merger-related costs.
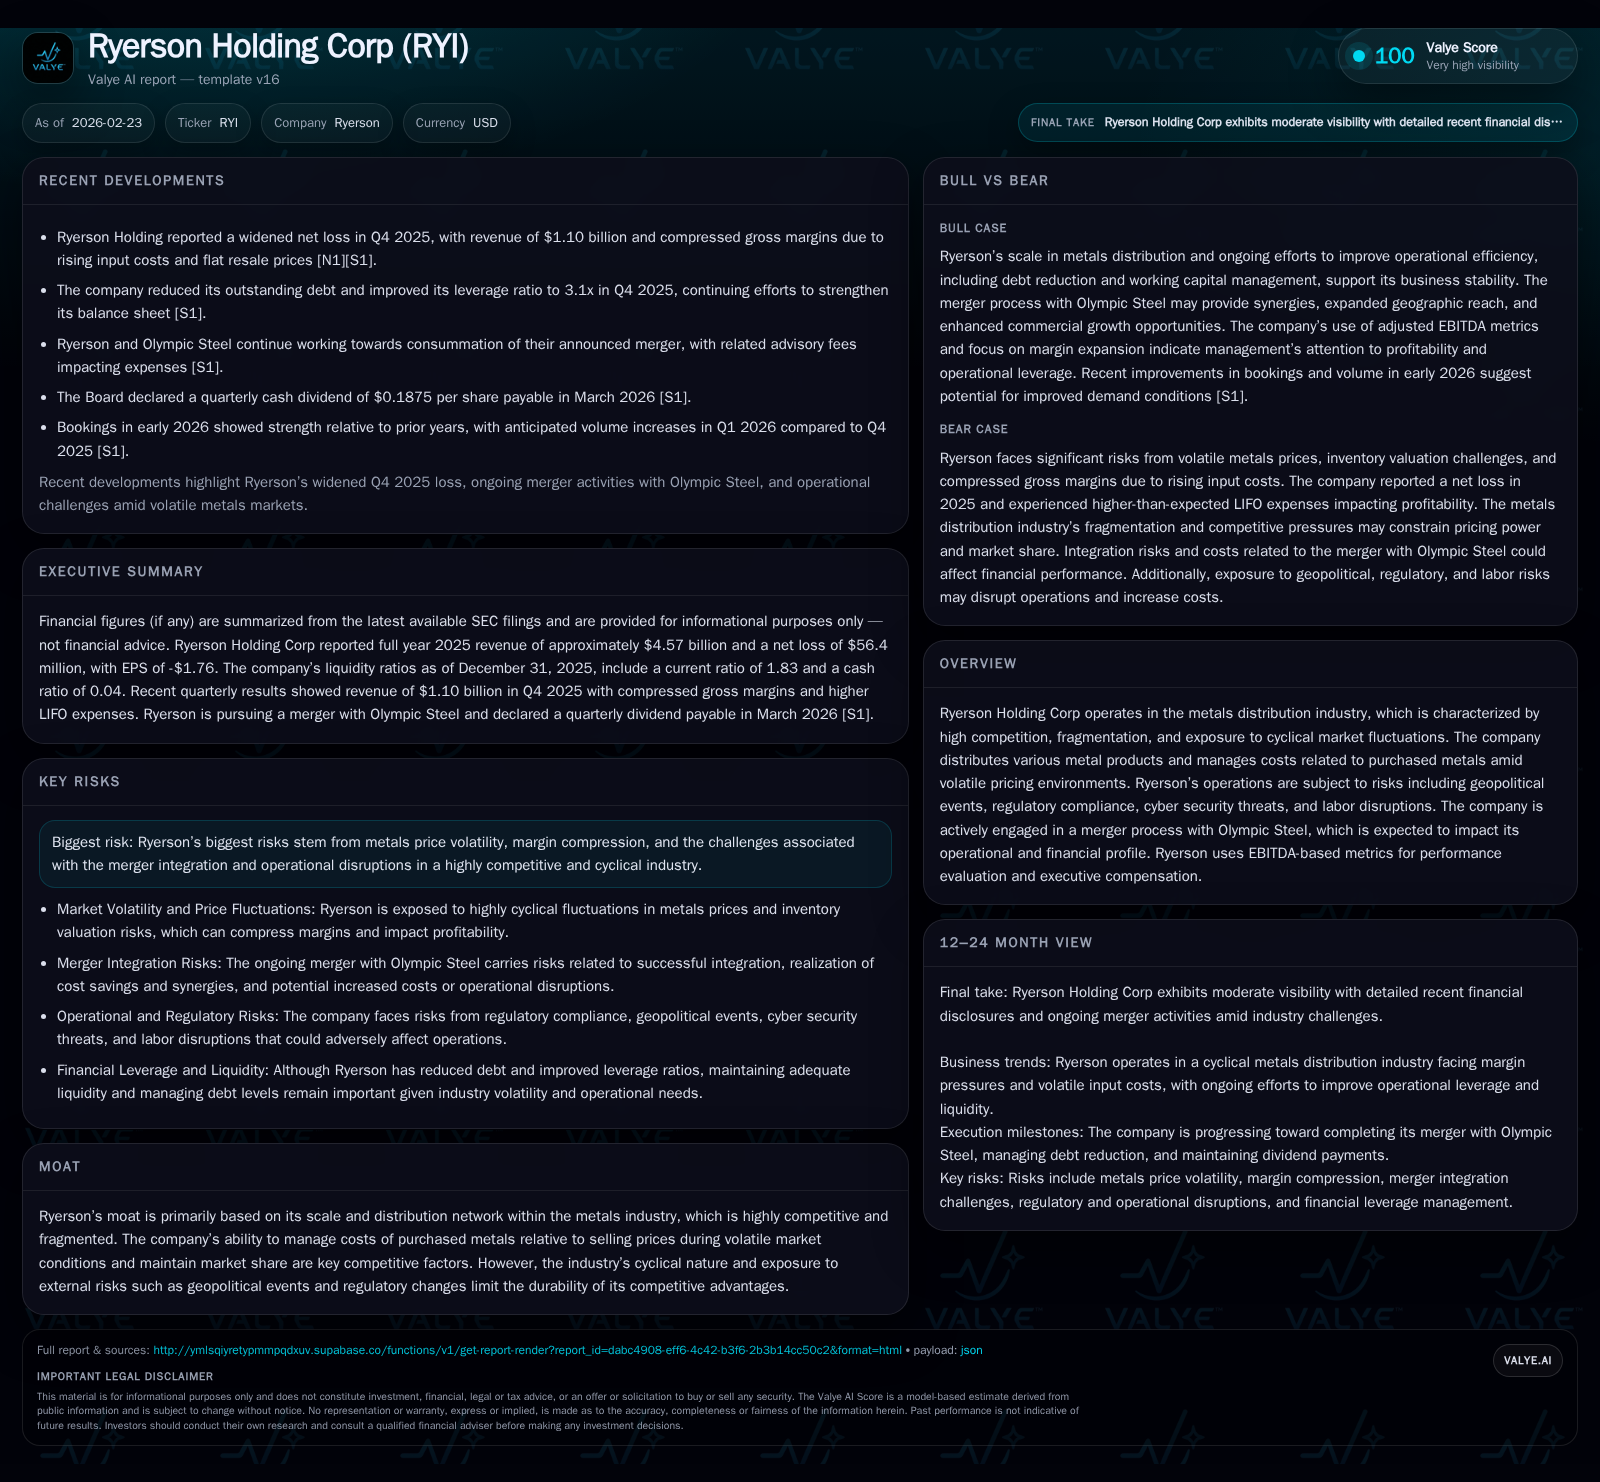
Ryerson Holding Corp's revenue saw a marginal decline in 2025, driven by soft industrial demand and volatile metal input costs which compressed gross margins significantly. Operating income swung from modest profitability in 2024 to a loss of $30.8 million, with net income declining sharply to -$56.4 million. The company's operational cash flow also halved year-over-year but remained positive, supporting a slim free cash flow generation despite reduced capital expenditures. The recent merger with Olympic Steel, closed in early 2026, promises scale benefits but introduces integration risks and elevated cost burdens in the near term. Market watchers will focus on Ryerson's ability to realize synergies from this consolidation while grappling with an unpredictable metals pricing environment and cyclical demand shifts.
Company Overview and Industry Context
Ryerson Holding Corporation operates within the highly competitive and fragmented metals distribution sector — an industry characterized by cyclical fluctuations linked closely to global industrial demand and commodity price volatility [S1][S4]. The company's distribution network spans a broad array of metal products, exposing it not only to operational complexities but also significant market risks including regulatory compliance challenges, cyber security threats, labor market dynamics, and geopolitical uncertainties [S4][S6].
Notably, Ryerson recently completed its merger with Olympic Steel in February 2026 [S13], a strategic transaction anticipated to reshape its operational footprint by augmenting scale and diversifying product offerings. While the merger is expected to unlock synergies and broaden market reach, it simultaneously entails near-term integration expenses and elevated complexity against an already volatile backdrop.
Historical Financial Performance
Analyzing Ryerson's last four fiscal years reveals a trajectory of declining top-line momentum amplified by profit margin pressures (table below). Revenue decreased slightly (0.6%) from $4.60 billion in FY2024 to $4.57 billion in FY2025 [F1]. This contraction primarily stems from subdued industrial demand that pressured volumes amid stagnant average selling prices.
Gross margin compression was notably acute in FY2025 due to surging raw material costs that outpaced resale prices; consequently, operating income swung dramatically from a positive $31.5 million in FY2024 to a loss of $30.8 million [F1]. Net income mirrored this downturn progressively: from a modest loss of $8.6 million to a substantial net loss of $56.4 million (-555.8% YoY) [F1]. This shift was exacerbated by higher LIFO inventory charges recognized during volatile metal price cycles [S12][S24].
Operating cash flows declined steeply by -57.5% to $87 million in FY2025 [F1], reflecting underlying margin stress combined with working capital adjustments related to inventory management during pricing turbulence. However, despite halved cash flow from operations relative to prior years, prudent capital spending reductions allowed for positive free cash flow generation (~$35.5 million) even amid tightening financial conditions [F1].
Historical performance (annual)
| FY | Rev ($bn) | Net ($mm) | CFO ($mm) | OpInc ($mm) | Rev YoY | Net YoY |
|---|---|---|---|---|---|---|
| 2025 | 4.6 | -56 | 87 | -31 | -0.6% | -555.8% |
| 2024 | 4.6 | -9 | 205 | 32 | -10.0% | -105.9% |
| 2023 | 5.1 | 146 | 365 | 228 | -19.2% | -62.7% |
| 2022 | 6.3 | 391 | 501 | 579 |
Note: Omitted columns lack sufficient annual XBRL coverage in the provided tags (need ≥2 annual points): Capex, Div. Source: SEC companyfacts cache [F1].
Capital returns and efficiency (annual)
| FY | Buybacks ($mm) | FCF ($mm) | ROE% |
|---|---|---|---|
| 2025 | 0 | 36 | -7.5 |
| 2024 | 51 | 105 | -1.1 |
| 2023 | 114 | 243 | 16.1 |
| 2022 | 50 | 396 | 44.2 |
Source: SEC companyfacts cache [F1].
*Note: Dividend data limited; buybacks ceased in FY2025.
Drivers Behind Past Performance
The key force behind Ryerson’s recent underperformance lies in the metals market volatility disrupting margin stability [S12][S24]. Input costs surged faster than passing through price increases on the selling side due to delayed contract repricing and weak spot market demand—compressing gross margins beyond initial expectations (17.2% down to mid-15% range quarterly) [S12]. Substantial LIFO inventory expenses due to accounting treatment of rising metal costs further depressed profitability.
Additionally, fourth quarter FY2025 included elevated merger-related advisory fees (approximately $7.8 million), reflecting integration preparation costs amid the emerging Olympic Steel merger deal [S12]. These non-recurring charges skewed expense lines upward during an already difficult period.
Capital structure also saw active management as Ryerson reduced net debt sequentially by approximately $34 million entering calendar year-end 2025 and renegotiated credit agreements extending maturities and increasing total commitments in anticipation of merger financing needs [S10][S17]. Leverage metrics improved quarter-to-quarter but still remain above typical target ranges (net leverage ~3x vs target of around 0.5-2x) [S11].
Near-Term Prospects & Catalysts
A critical future growth driver lies in fully realizing the Olympic Steel merger’s strategic benefits which closed February 13, 2026 [S13]. This acquisition is expected to add estimated incremental revenues around $260-$280 million for roughly six weeks of Q1 alone, boosting total sales substantially [S11]. Cross-selling opportunities, geographic expansion into Midwest processing hubs, and economies of scale are cited as primary synergy levers.
First quarter guidance anticipates volume growth between +13-15%, with flat-to-moderate pricing gains up to +2%, projecting adjusted EBITDA excluding LIFO between $51-$54 million [S11]. Management expects gross margin recovery partially as higher inventory costs realized last quarter transition into selling price improvements.
However, these prospects hinge significantly on smooth integration execution, effective cost control amid elevated working capital demands for amalgamated operations as well as external industry conditions including tariffs, supply chain disruptions, and raw materials cost swings remaining manageable [S19][N2].
Monitoring inbound order trends will be crucial given the industry’s cyclicality; early month bookings have been described as stronger relative to historical analogs which fuels cautious optimism but remains subject to macroeconomic volatility risks such as trade policy shifts or geopolitical tensions influencing metals supply-demand balance.
Capital Allocation & Returns Profile
Ryerson has historically deployed capital toward sustaining operations plus share repurchases until recent fiscal years when buybacks ceased and dividends have been variable depending on Board discretion [F1][S26][S28][S29]. The company’s return on equity calculated approximately negative at -7.5% for FY2025 reflecting net losses against equity base near $753 million [F1].
Free cash flow generation was positive but diminished compared with prior periods owing largely to compressed operating cash flows partly offsetting lower capex levels—a cut nearly halving investment spend versus prior year (from ~$99 million down to ~$52 million) [F1].
Given leveraged balance sheet posture post-merger amended credit facility increase ($1.8 billion total commitments extended out five years), management emphasizes deleveraging back toward targeted leverage ratios before resuming aggressive shareholder payouts or re-initiating buybacks [S17][S26]. This suggests capital discipline focused on stabilizing financial footing amidst ongoing integration costs and market uncertainties.
Industry Considerations & Risks
As a metals distributor exposed directly to commodity price cycles and industrial production trends globally, Ryerson faces significant market cyclicality affecting volumes and pricing power quarterly [S4]. External factors such as tariffs on steel imports/exports, US manufacturing policy changes, geopolitical conflicts impacting metals supply chains (including sanctions), and currency fluctuations add layers of operating risk with potential impact on inventory valuations and margins.
Operational risks compound these external threats: cyber security vulnerabilities threaten infrastructure resilience; labor disputes or material shortages can disrupt processing centers; underfunded pension liabilities may pressure cash resources; regulatory changes might impose added compliance costs or limit operational flexibility domestically or abroad [S19][S27].
The merger integration itself carries inherent uncertainty regarding realization of projected synergies or potential unforeseen expenses which could weigh on near-term earnings performance despite long-term strategic rationale.
What To Watch Next (Analysis)
Without explicit multi-year guidance disclosed beyond Q1’26 metrics mentioned above [S11], investors should monitor:
- Post-merger quarterly financial results for synergy capture verification;
- Trend analysis of gross margins excluding LIFO effects;
- Operating leverage improvements amid volume rebound;
- Changes in working capital intensity tied to amalgamated inventory management;
- Evolution of leverage ratio vs stated targets following merger-related debt refinancing;
- Regulatory or geopolitical developments affecting import/export duties or supply chain integrity;
- Any updated commentary on dividend policy or capital return programs post-deleveraging.
These indicators will offer insight into whether Ryerson can successfully navigate typical industry cyclicality compounded by transaction complexity while regaining profitability momentum.
Disclaimer: This analysis is for informational purposes only and does not constitute investment advice or recommendations regarding the securities of Ryerson Holding Corporation.
Disclaimer: This is research-only, informational analysis and not investment advice. It may include AI-generated interpretation and general industry context. Always verify important details using primary sources.
Comments