
Thor Industries Cuts FY26 EPS Forecast as Sector Cyclicality Bites
Thor's Q3 2026 filings show a significant earnings guidance downgrade driven by softer demand and supply chain bottlenecks in the recreational vehicle market.
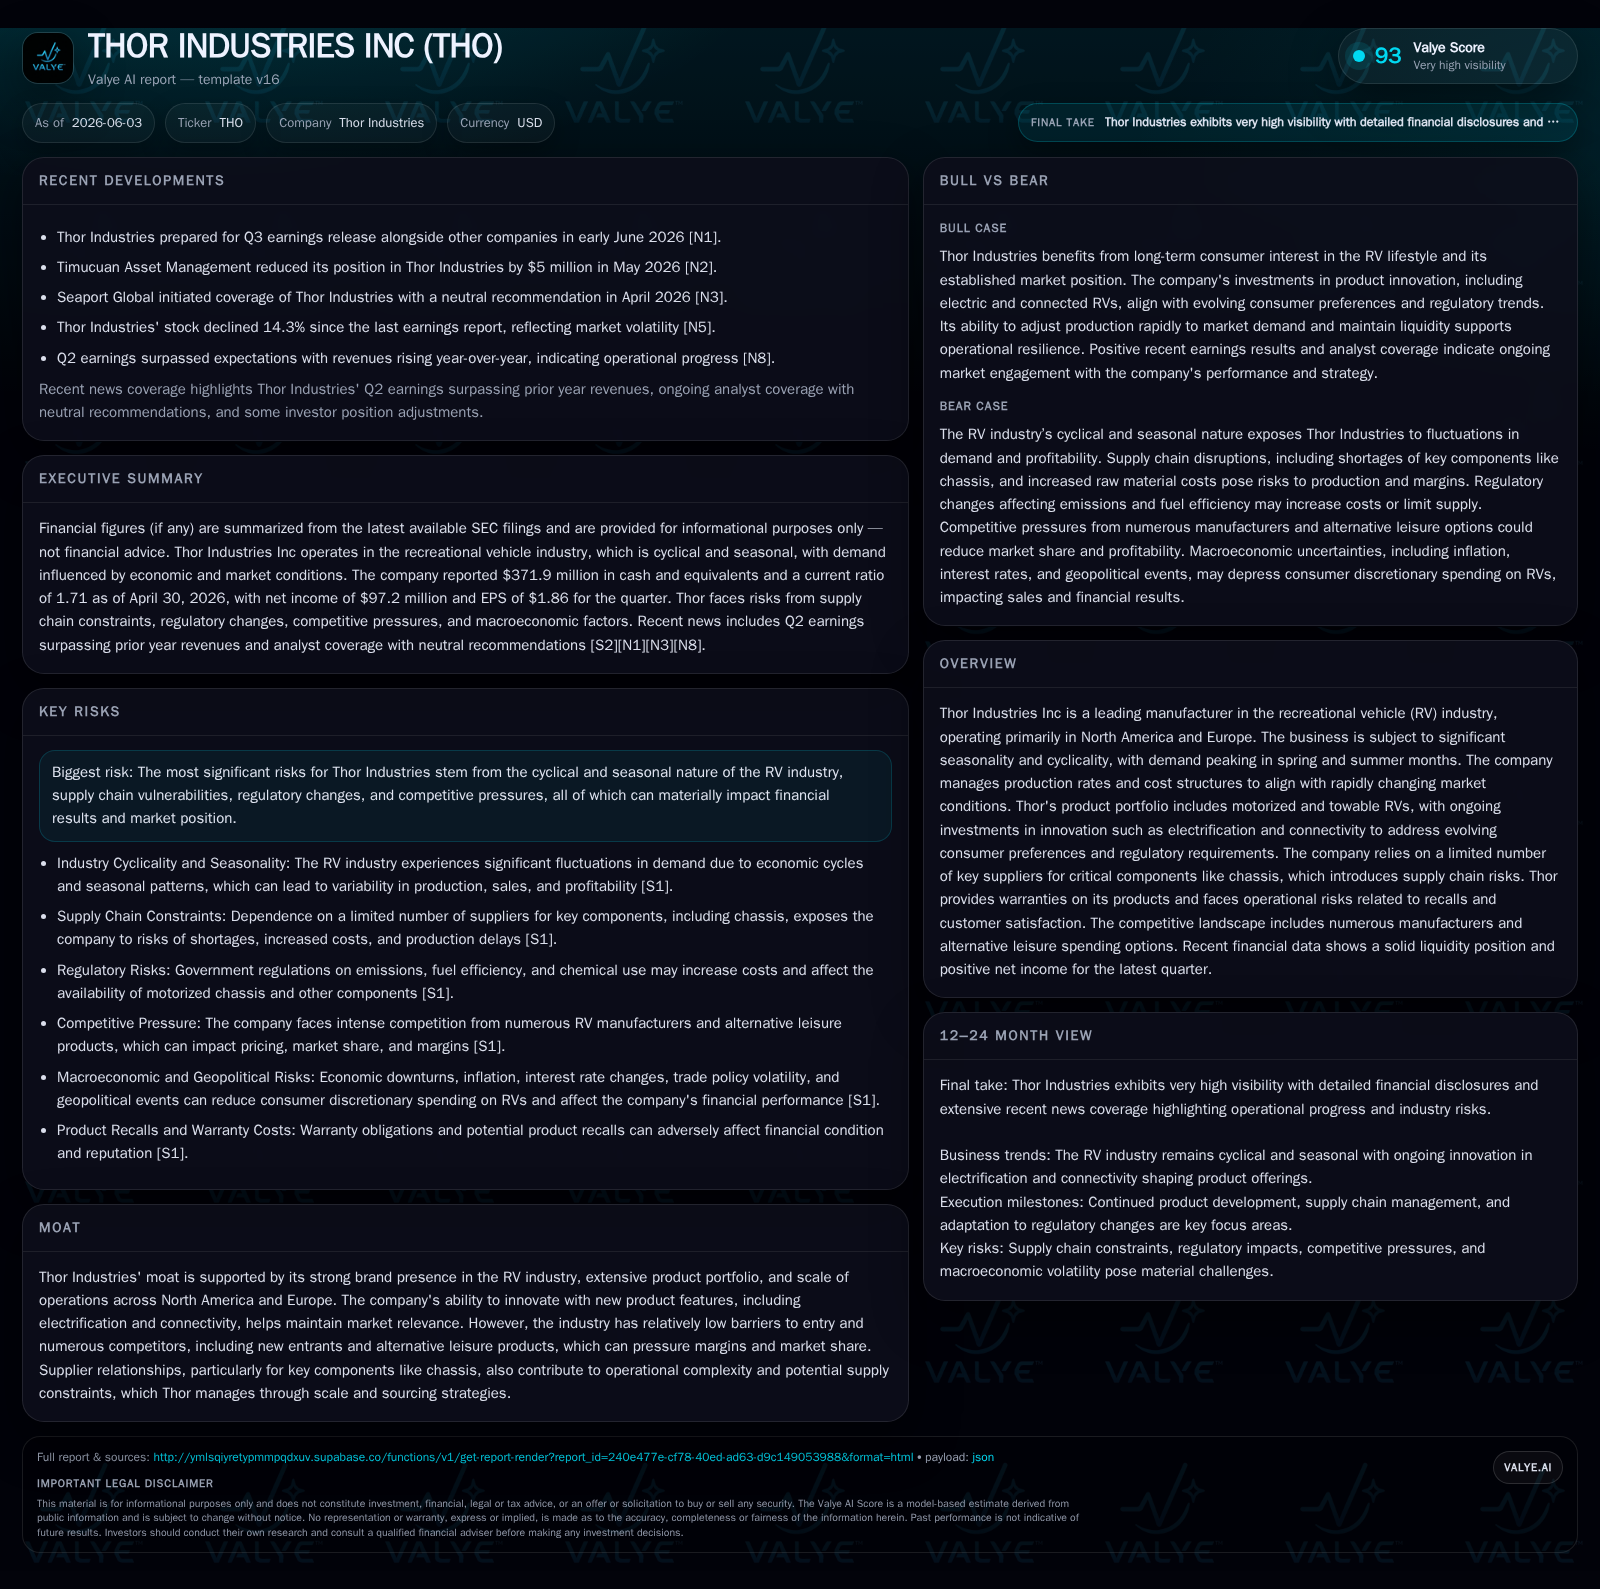
In its June 2026 quarterly filing, Thor Industries slashed its fiscal year 2026 EPS forecast, reflecting ongoing cyclicality and pronounced supply chain constraints, notably chassis availability. The seasonal nature of RV demand continues to challenge production alignment and margin stability. Thor's business model balances motorized and towable RV offerings with rapid production adjustments amid volatile market conditions. Expansion efforts hinge on innovation in electrification and connectivity amid competitive pressures and regulatory risks. Investors should monitor throughput improvements, supply chain normalization, and summer dealer orders as key execution milestones.
Q3 Operating Update: Earnings Outlook and Market Realities
Thor Industries’ latest quarterly filing dated June 3, 2026 ([S2], [S3]) revealed a marked downward revision of its fiscal year 2026 EPS guidance. Management attributed this revision primarily to softer-than-anticipated wholesale demand compounded by persistent supply chain bottlenecks, most notably limited availability of chassis components sourced from key suppliers. These factors have pressured production output flexibility and curtailed margin improvement despite the firm’s efforts to optimally align costs with cyclical demand swings. The updated investor presentations ([S3]) further underscore the urgency of managing short-term volatility while maintaining strategic investments for long-term competitiveness.
Business Model: Product Strategy and Operational Flexibility
Thor generates revenue chiefly through sales of motorized and towable recreational vehicles primarily across North America but also in European markets ([S1]). Customers — encompassing retail consumers, dealerships, and fleets — pay for finished vehicles configured with varying premium features including electrified drive systems and IoT connectivity enhancements increasingly integrated into newer models. Revenue dynamics are governed by seasonal patterns: peak demand materializes during spring and summer months when leisure travel activity surges, necessitating precise modulation of manufacturing throughput to avoid costly inventory swings.
To address this volatility, Thor has engineered operational flexibility allowing rapid ramp-up or scale-down of production volumes in response to real-time dealer orders and macroeconomic environment shifts ([S2]). The company’s reliance on key suppliers for chassis constrains this agility but is partially mitigated by strategic sourcing partnerships fostered over decades ([S1]). This dual-product line—motorized versus towable—diversifies exposure but also entails complex cost management across disparate manufacturing processes.
Industry Dynamics: Competition, Seasonality, and Supply Risks
The RV industry is fragmented with relatively low barriers to entry, attracting numerous mid-sized players alongside Thor [[S1]]. While scale affords Thor advantages in brand recognition, distribution breadth, and R&D capabilities—especially in electrification innovation—the sector’s competitive pressures limit sustainable pricing power. Industry-wide seasonality drives sharp periodic revenue inflows predominantly aligned around peak outdoor travel seasons. This cyclicality necessitates agile inventory and workforce management that can strain operating margins if misaligned.
Supply chain vulnerabilities remain critical; chassis suppliers represent a narrow node in the value chain where capacity constraints directly bottleneck finished goods output ([S2]). Commodity price fluctuations combined with labor cost inflation add further margin sensitivity. Dealer consolidation intensifies negotiation leverage on pricing terms at wholesale levels while independent dealers’ financing health also influences retail sales velocity ([S24], [S27]).
Growth Drivers: Innovation, Market Penetration, and Product Mix
Thor’s growth strategy leverages technological innovation including electrification of motorhomes and enhanced connectivity features aimed at improving user experience with smart controls and diagnostics ([S1]). Geographic diversification across established markets in North America complemented by expanding penetration within Europe provides additional avenues for revenue growth.
A pivot towards premium and luxury segments enriches product mix favorably impacting average selling prices. Investments targeting sustainability align with evolving regulatory mandates threatening legacy internal combustion engine platforms ([S1]). Enhanced customization capability aims to augment customer retention by leveraging switching cost dynamics inherent to vehicle ownership coordination via digital ecosystems.
Risks & Constraints: Cyclicality, Supply Chain Vulnerabilities, Regulation
Cyclical contractions triggered by macroeconomic headwinds reduce discretionary spending capacity among end consumers leading to demand shocks that ripple through dealer inventories to manufacturing schedules ([S1], [S13]). Persistent supply chain constraints — especially the availability of critical components like chassis frames — constrain volume scalability creating risk of lost sales or forced discounting detrimental to margins ([S2]).
Regulatory compliance costs from vehicle safety standards impose recurring expenses including warranty provisions and contingencies for recalls triggered by defects or supplier quality issues ([S14]). Ignoring these risks could erode brand equity severely given the highly competitive environment requiring sustained product reliability.
What Investors Should Watch Next: Guidance and Execution Triggers
Key near-term indicators include the trajectory of supply chain normalization—with emphasis on chassis deliveries—and corresponding manufacturing throughput improvements. Monitoring dealer order fill rates during the pivotal summer selling season will provide insight into underlying market demand strength post-guidance cut ([N4], [S2]).
Management commentary from recent investor presentations suggests continued focus on new product launches featuring electrified platforms which may shift product mix favorably if successfully received. Cost control metrics amid inflationary pressures plus any updates on recall liabilities or warranty reserves will also be important operating levers to track ([S3]).
Financial Profile Snapshot: Capital Structure and Liquidity
As of April 30, 2026, Thor maintains cash and equivalents near $372 million against total debt approximating $883 million resulting in net debt around $511 million—a moderate leverage profile supporting operational flexibility ([F1]). Amended credit facilities extending term maturities beyond 2030 reduce refinancing urgency while interest rate reductions obtained in prior amendments alleviate some financing cost burdens ([S4], [S5], [S6]).
Overall liquidity appears sufficient to fund capital expenditures focused on facility improvements alongside dividends and share repurchases authorized up to mid-2027 timeframe ([F1], [S9]). However, eclipse risk from unexpected cyclical downturns or intensified supply disruptions cannot be fully discounted.
This analysis is based solely on publicly disclosed information without any investment research view. It aims to provide a comprehensive understanding of Thor Industries’ current operational context within the recreational vehicle sector as of mid-2026.
Disclaimer: This is research-only, informational analysis and not investment advice. It may include AI-generated interpretation and general industry context. Always verify important details using primary sources.

Comments