
TJX’s Fiscal Q1 Shows Resilience and Strategic Advantages Amid Retail Sector Dynamics
TJX reported strong Q1 results with revenue growth, robust liquidity, and continued operational focus, reinforcing its leadership in off-price retail.
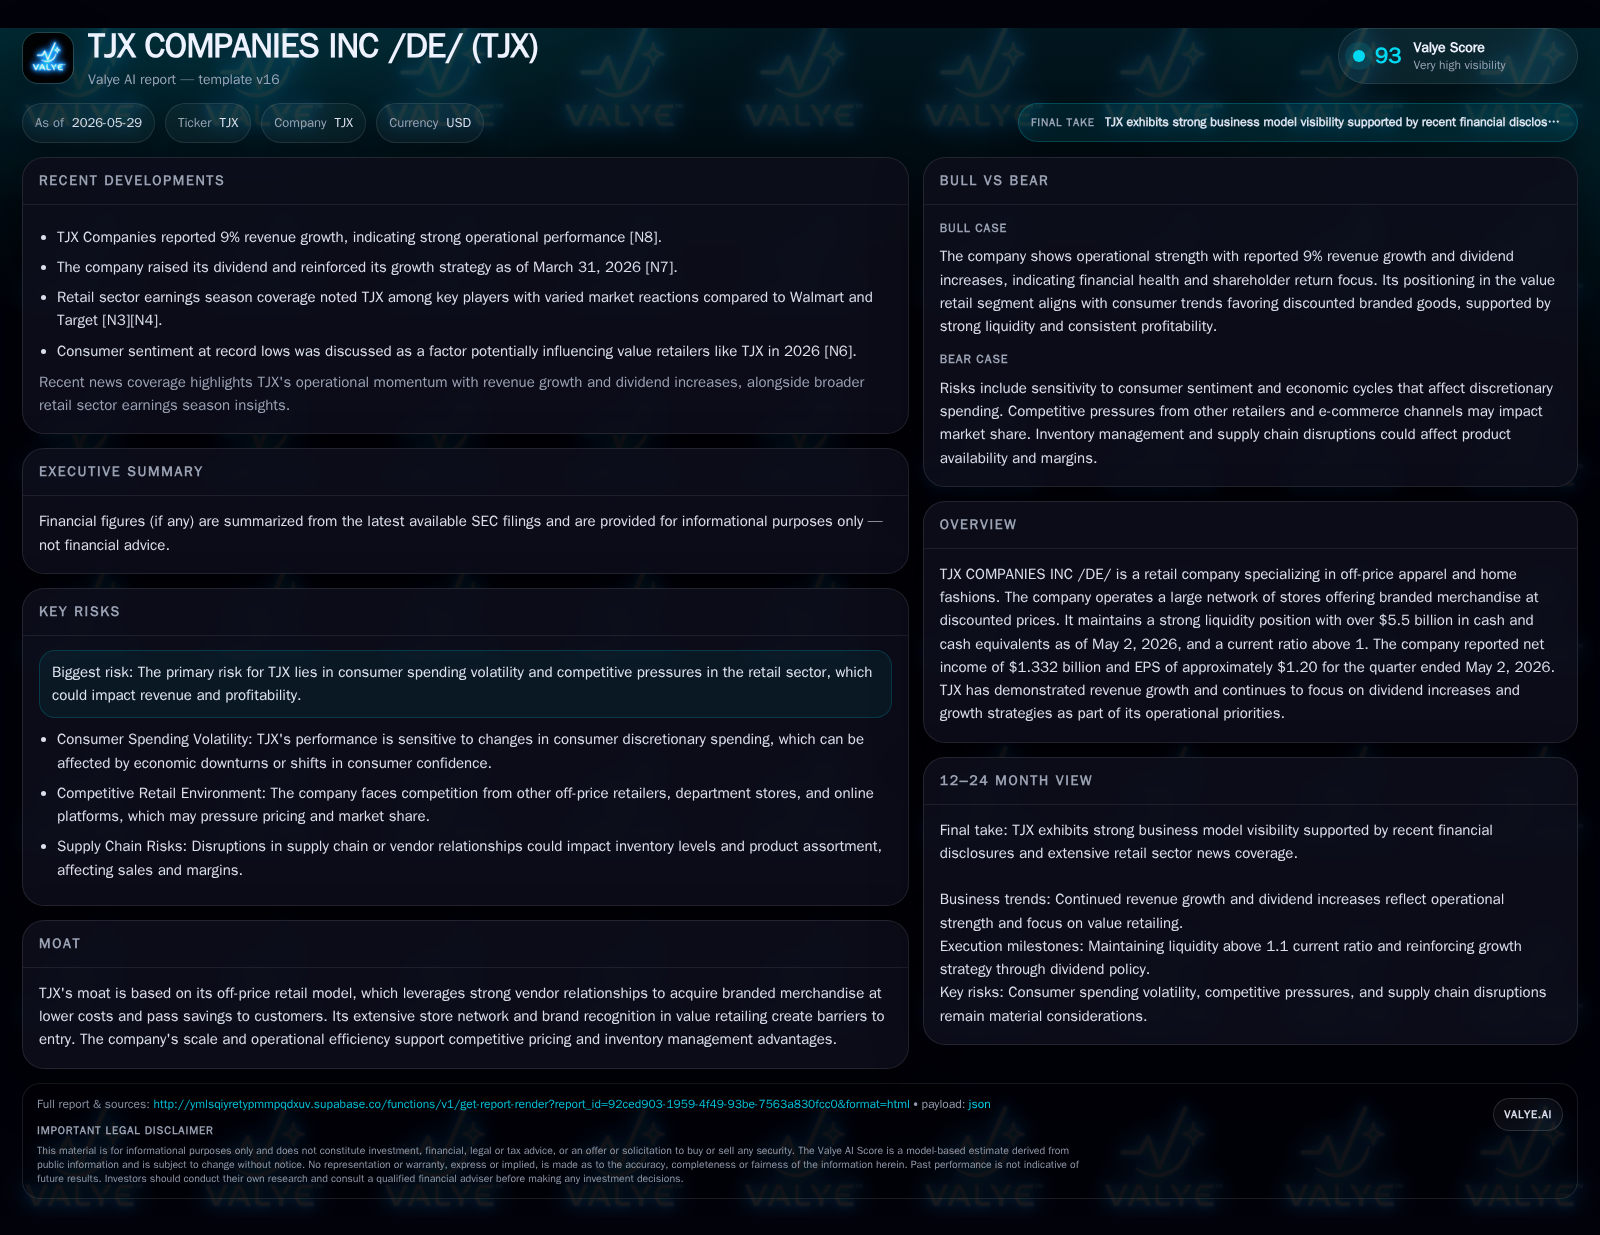
In the fiscal first quarter ended May 2, 2026, TJX Companies demonstrated operational resilience and strategic strength within the off-price retail sector. The company reported solid revenue growth, high net income, and a healthy cash position, underscoring the durability of its business model amid evolving consumer behaviors. Leveraging deep vendor relationships, a broad store network, and inventory management efficiencies, TJX is well-positioned to capitalize on value-seeking consumer trends despite retail sector competitive pressures.
Quarterly Operational Update: Key Takeaways from Q1 2026 Filing
TJX’s latest quarterly filing for the period ended May 2, 2026, reaffirms its operational robustness within a challenging retail environment. The company posted net income of approximately $1.332 billion with earnings per share near $1.20, reflecting steady profitability improvements that align with ongoing revenue gains [S2][S3][F1]. Strong cash generation coupled with a cash & equivalents balance exceeding $5.5 billion provides a significant liquidity cushion, further enhanced by a current ratio of 1.14 as of quarter-end [F1]. This translates into healthy short-term asset coverage over liabilities.
Management commentary highlights sustained momentum driven by increased customer traffic and favorable merchandise mix, underpinning top-line expansion [S2]. Importantly, TJX continues to pursue dividend increases as part of shareholder return strategy while investing selectively in capacity and brand-building efforts [S3], reinforcing confidence in stable cash flows.
Off-Price Retail Business Model: Revenue Drivers and Customer Value Proposition
TJX operates principally in off-price apparel and home fashions—sourcing branded inventory at discounted prices through deep vendor relationships cultivated over years [S1]. This advantage enables procurement of goods that might be surplus or out-of-season from suppliers at costs well below traditional retail pricing benchmarks.
Revenue mechanics revolve around converting these inventory acquisitions into an extensive store footprint comprising multiple formats (e.g., T.J. Maxx, Marshalls) where customers seek branded items at significant savings [S1]. Volume drives largely from increasing store traffic combined with efficient inventory turns intrinsic to the off-price format's "treasure hunt" shopping experience.
Pricing power roots in the company's ability to maintain favorable cost structures despite competitive pricing pressures—enabling margins to remain resilient even if absolute price points fluctuate moderately. Operational quality reflects in quick inventory cycle times and a product mix deliberately skewed toward high-value categories appealing strongly to budget-conscious yet brand-sensitive consumers.
Switching costs for customers emerge primarily through brand loyalty to TJX's curated value proposition—the difficulty for shoppers in replicating similar assortment depth elsewhere sustains repeat patronage.
Industry Positioning: TJX Among Peers in Discount Merchandise Retailing
Within the discount retail sector, TJX stands out by scale and breadth of offerings compared to peers like Burlington Stores or Ross Dress for Less [N2][N5]. While all compete on price sensitivity metrics, TJX's more diversified category exposure (apparel plus home fashions) broadens customer appeal.
Analyst commentary suggests TJX commands premium pricing power relative to peers owing to superior inventory sourcing agility and brand assortment uniqueness [N7]. However, it operates in a highly competitive segment where shifts in consumer sentiment rapidly influence retail traffic patterns.
Sector-wide pressures from inflationary inputs or wage cost upticks can compress margins across players but TJX’s operational efficiencies mitigate these risks more effectively than smaller rivals given its investment in technology-enabled supply chain improvements [N3].
Competitive Moat: Vendor Relations, Scale Benefits, and Inventory Efficiency
TJX’s moat fundamentally derives from its entrenched supplier networks allowing it early access to discounted branded products that fuel turnover velocity [S1]. These vendor relationships reduce input costs relative to competitors reliant on more standard procurement channels.
Furthermore, scale economies across an expansive store base leverage logistics and distribution synergies—lowering per-unit fulfillment costs while supporting aggressive markdown management strategies.
Inventory management systems optimized for rapid assortment refreshment enable TJX to respond flexibly to fashion cycles without bogging down capital in stagnant stock. This dynamic turnover benefits both gross margins and working capital efficiency.
Such integrated procurement-to-shelf capabilities create formidable entry barriers for newer entrants attempting to replicate the off-price proposition at comparable quality and price points.
Growth Drivers: Expansion Plans, Store Network Optimization, and Consumer Trends
Growth catalysts include measured expansion into under-penetrated markets supported by targeted new store openings disclosed in recent filings [S2]. Continuous evaluation of existing locations aims at optimizing footprint productivity through remodels or lease renewals aligned with evolving shopping habits.
Consumer trends demonstrably favor discount retailers amid ongoing economic uncertainty; sentiment indices point to increasing value orientation among apparel buyers which bodes well for TJX’s core offering [N12].
E-commerce integration remains secondary but complementary; the company emphasizes physical store experiences critical for its treasure-hunt dynamic while exploring omnichannel extensions cautiously.
Selective international expansions or format innovations represent potential medium-term accelerators though near-term focus remains domestic market penetration.
Risks and Constraints: Consumer Spending Volatility and Sector Competition
Key headwinds stem from macroeconomic sensitivity inherent in discretionary spending categories such as apparel [S21][S1]. Consumer spend contraction during downturns could quickly reduce transaction counts or average basket sizes pressuring revenues.
Competitive intensity is mounting as traditional department stores recalibrate pricing models while online pure plays amplify discount offerings creating cross-channel friction.
Margin compression risk arises not just from input cost inflation but also from necessary promotional activity if traffic lags expectations—implying careful balance is needed between volume stimulation and price realization.
Regulatory developments affecting labor markets or sourcing could impose cost burdens or complicate supply chains further constraining operational flexibility.
Looking Forward: Key Catalysts and Milestones to Track in Upcoming Quarters
Important near-term indicators include same-store sales performance updates reflecting demand sustainability post-Q1 momentum [S2][S3]. Monitoring margin trends will reveal whether pricing power endures amid ongoing sector cost pressures.
Execution on expansion plans including pace of new stores opened versus closed will clarify growth trajectory credibility.
Inventory turnover rates will serve as signals for merchandise mix effectiveness alongside shifts in customer buying patterns post-inflation era recalibrations.
Dividend announcements remain watchpoints given management's emphasis on return of capital alignment with cash flow generation strength documented recently [S3]
Financial Overview: Latest Liquidity, Profitability, and Capital Allocation
TJX maintains robust financial health illustrated by $5.58 billion cash & equivalents providing significant liquidity reserves as of May 2, 2026 [F1]. Total debt stood near $2.88 billion earlier in calendar year January 2026 yielding a net debt negative position of roughly $2.7 billion indicative of a clean balance sheet [F1].
Profitability metrics reflect net income surpassing $1.3 billion for the quarter with EPS near $1.20 underpinning core earnings stability despite sector uncertainties [S2][F1]. Capital deployment prioritizes dividend increases consistent with long-term shareholder distribution policies supplemented by selective reinvestment into growth initiatives documented in quarterly commentary [S3].
Overall financial posture complements operational strengths offering flexibility against potential downside scenarios while enabling articulated organic expansion pathways.
This analysis is based solely on available SEC disclosures as of May 29, 2026 [S1,S2,S3], corroborated by validated companyfacts data snapshots as referenced [F1], supplemented with sector context interpretation without speculative forecasts or investment research views. Readers should consult original filings for definitive financial details.
Disclaimer: This is research-only, informational analysis and not investment advice. It may include AI-generated interpretation and general industry context. Always verify important details using primary sources.

Comments