
Triton International's Scale and Lease Portfolio Underpin Stability Amid Trade Imbalance Risks
Triton International Ltd leverages its position as the largest intermodal container lessor with a diverse lease portfolio and strong logistics management to sustain steady financial performance.
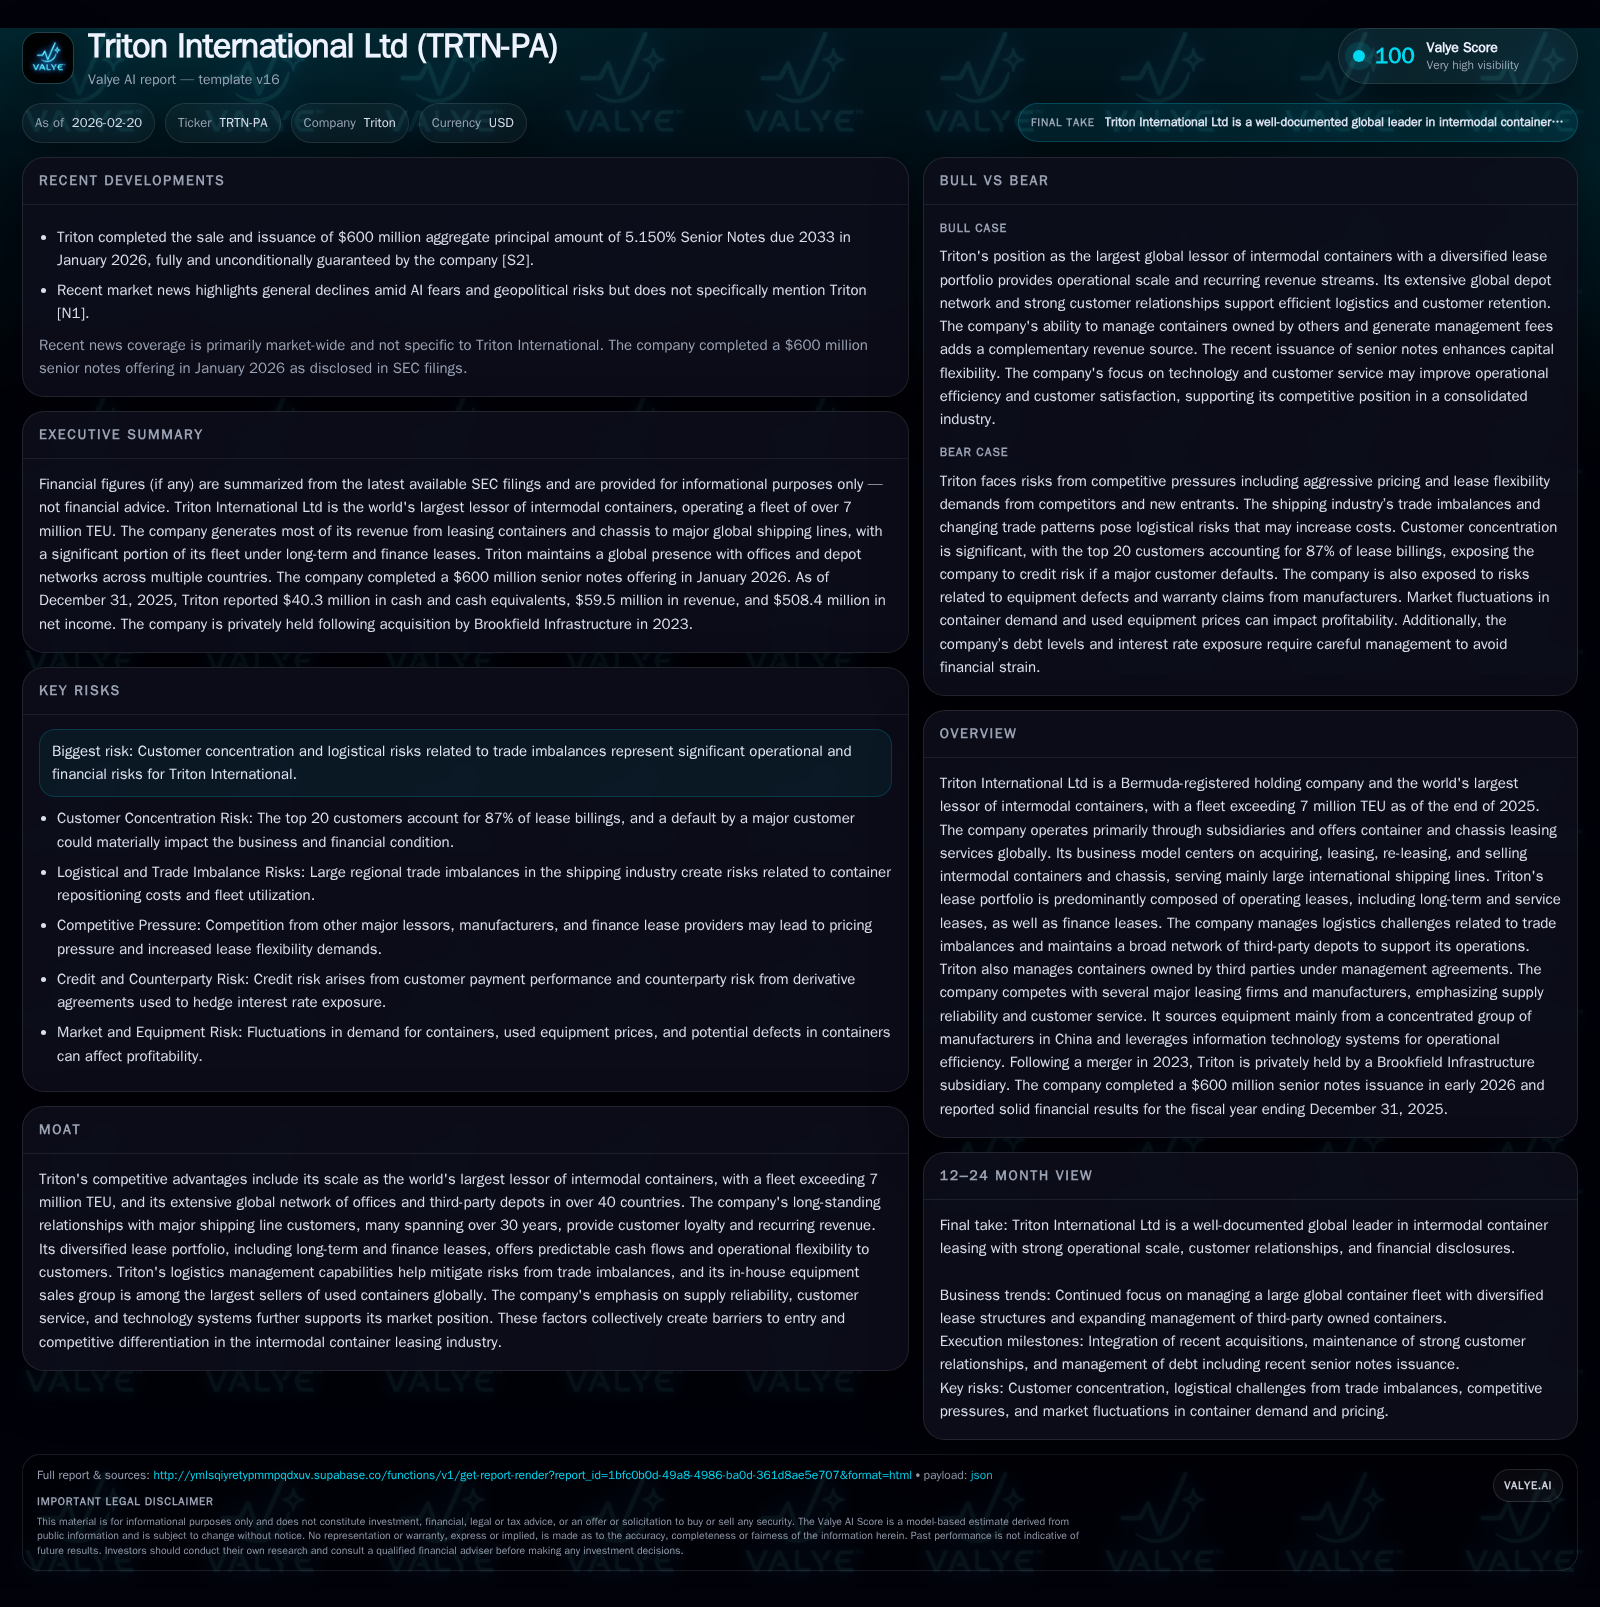
Triton International Ltd remains the world's leading lessor of intermodal containers with a fleet exceeding 7 million TEU. The company's historical growth has been driven by strategic acquisitions, disciplined lease structuring, and robust customer relationships, supporting a largely recurring revenue model despite modest recent operating income contraction. Going forward, growth hinges on container demand tied to global trade patterns and efficient management of trade-related imbalances. Capital deployment focuses on modest reinvestment capex, debt refinancing, and servicing cumulative preferred dividends; common share dividends have ceased post-privatization. Risks center on customer concentration and logistical challenges inherent in international container flows.
Company Overview and Historical Performance
Triton International Limited, registered in Bermuda, solidified its status as the global leader in intermodal container leasing through steady organic growth complemented by selective acquisitions. As of December 31, 2025, it managed an owned and third-party managed fleet totaling more than 7 million twenty-foot equivalent units (TEU), comprising roughly 4.3 million containers and chassis with an aggregate cost equivalent unit (CEU) count near 7.8 million [S1][S19]. The July 1, 2025 acquisition of Global Container Inc. (GCI) contributed approximately 0.3 million containers (0.5 million TEU), further enhancing scale.
Financially, Triton's revenue grew sharply from around $48.6 million in FY2024 to approximately $59.5 million in FY2025—a year-over-year increase of ~22.4%. This reflects expansion of lease volumes alongside favorable market conditions [F1]. Operating income slightly contracted by approximately 1.1%, from $826.6 million to $817.4 million during the same span. Net income similarly edged down by roughly 1.9% from $518.2 million in FY2024 to $508.4 million in FY2025 [F1].
The divergence between revenue growth and flat-to-declining operating profit likely reflects margin compression attributable to pricing pressures during competitive leasing markets globally and elevated logistics costs arising from container trade imbalances [S12][S17]. Nevertheless, Triton's profitability remains solid given its operational scale and established customer base.
Historical performance (annual)
| FY | Rev ($mm) | Net ($mm) | CFO ($mm) | OpInc ($mm) | Rev YoY | Net YoY |
|---|---|---|---|---|---|---|
| 2025 | 60 | 508 | 972 | 817 | +22.4% | -1.9% |
| 2024 | 49 | 518 | 1113 | 827 | ||
| 2021 | 96 | 474 | 1150 | 769 | +11.9% | +43.8% |
| 2020 | 86 | 330 | 944 | 641 |
Note: Omitted columns lack sufficient annual XBRL coverage in the provided tags (need ≥2 annual points): Capex, Buybacks. Source: SEC companyfacts cache [F1].
Capital returns and efficiency (annual)
| FY | Div ($mm) | FCF ($mm) | ROE% |
|---|---|---|---|
| 2025 | 0 | 19.7 | |
| 2024 | 0 | 18.4 | |
| 2021 | 116 | 942 | 16.1 |
| 2020 | 146 | 200 | 12.9 |
Source: SEC companyfacts cache [F1].
*Capex annual figures available only for prior years pre-2021; recent decline noted via SEC disclosures [F1].
Lease Portfolio Structure & Customer Relationships
Central to Triton's business model is a diversified lease portfolio focused mainly on operating leases that include both long-term firm commitments and more flexible service leases [S20]. The operating leases allow customers—the world's largest shipping lines—to adjust container usage dynamically responding to volatile cargo flows worldwide.
Approximately two-thirds or more of the fleet is committed under operating leases designed for high utilization rates throughout asset lifecycles by enabling multiple pick-up/drop-off cycles per container [S20]. Finance leases compose a smaller but strategically important portion providing customers capital alternatives.
Long-standing relationships underpin recurring lease revenues; most top customers have engaged Triton for over three decades [S4][S5]. These enduring ties afford stability in revenues despite cyclical transportation industry dynamics. The top twenty customers accounted for approximately 87% of lease billings at the end of FY2025 [S5], indicating significant but managed concentration risk.
Logistics Management & Trade Imbalance Challenges
Container shipping faces inherent global trade imbalances—particularly between Asia's export-heavy economies and consumer markets like North America/Europe—leading to costly empty repositioning movements that pose operational risks [S17]. Triton employs sophisticated logistics management using its extensive network of over 450 third-party depot facilities across more than forty countries to mitigate these risks efficiently.
Contracts often contain clauses limiting lessees’ ability to drop containers outside high-demand regions like Asia, helping reduce costly unproductive repositioning [S17]. Despite this approach, unpredictable shifts in trade patterns and regulatory changes maintain logistics as a key risk factor.
Industry Competition & Supplier Relations
The competitive landscape includes several large intermodal lessors plus manufacturers who also offer leasing options or direct sales [S13]. Price competition is fierce during periods of excess supply or slowing demand.
Despite this environment, Triton's advantages lie in scale—being the largest global lessor with over seven million TEU—the breadth of its international office network (21 offices plus agents across fifteen countries), reputation for reliable equipment supply, and superior customer service enabled by proprietary information technology systems that facilitate real-time inventory tracking and lease administration [S13][S17].
Supplier relationships are concentrated primarily among Chinese manufacturers supplying steel container shells under stringent quality control measures implemented through onsite factory inspections by Triton's procurement team [S13].
Capital Structure & Liquidity Position
Since its privatization by Brookfield Infrastructure via Thanos Holdings Limited in September 2023—the company’s common shares ceased public trading—but the preference shares remain listed on NYSE [S1]. As such, common equity dilution or traditional public dividend distributions are currently restricted.
Recent capital market activity includes issuance on January 21, 2026 of $600 million aggregate principal amount senior notes maturing in 2033 at a fixed coupon rate of 5.15%, enhancing liquidity headroom for fleet growth or refinancing purposes [S2]. Notably, preferred shares cumulatively pay fixed quarterly dividends ranging from approximately 5.75% up to near 8.50%, representing a significant fixed charge obligation prioritized above common equity distributions [S11][S3].
The company's debt profile balances secured asset-backed securitization warehouse facilities alongside unsecured revolving credit lines maturing through the next decade [S6][S7][S8][S10], maintaining financial flexibility amid macroeconomic uncertainties including interest rate fluctuations hedged via swap agreements reducing floating-rate exposure [S15][S16][S22][S25].
Capital Allocation & Returns Metrics
Free cash flow generation remains robust given relatively low capital expenditure requirements following recent major fleet investments—FY2025 CFO totaled about $972 million while capex was materially lower compared to previous years (historical spending saw multi-hundred million-dollar investments but shrank dramatically circa FY2024–25) resulting in FCF approximating $764 million [F1].
Reported ROE stood near ~19.7% based on net income relative to shareholder equity at December 31, reflecting efficient asset deployment within this asset-intensive leasing sector albeit subject to leverage influence [F1].
Common stock dividends have not been paid post-privatization; instead capital alignment focuses on servicing preference share dividends alongside prudent debt management while positioning liquidity for accretive acquisitions similar to GCI completed mid-2025 [S11][F1].
Forward Outlook & Key Milestones To Monitor
Growth prospects depend on sustained global trade volumes supporting container demand bolstered by expanding international freight flows over the medium term but tempered by geopolitical risks affecting supply chains and possible regulatory tightening affecting refrigerated container specifications or environmental compliance costs [N3][S12].
Maintaining high utilization rates through efficient re-leasing cycles remains pivotal amidst potential lease price pressure from new entrants or large manufacturer direct leasing offerings.
Potential fleet expansions via targeted acquisitions or alliances may continue supplementing organic growth if executed prudently.
Debt maturity schedule resembles a focus area; upcoming refinancing terms will reveal capital market conditions impacting interest expense trajectory given current swap hedges cover part but not all floating rate exposure beyond ~4-years horizon [S2][S15].
Monitoring customer credit health is critical given concentration—any major lessee distress could pose material adverse impacts.
Risks Summary
Principal risks include:
- Significant customer concentration risks with top clients accounting for nearly nine-tenths of lease revenues creating vulnerability albeit mitigated by long-term relationships [S5].
- Operational exposure to logistics inefficiencies due to asymmetric trade flows causing costly container repositioning challenges compounded by dynamic shipping patterns post-pandemic or driven by geo-economic developments [S12][S17].
- Environmental regulations affecting refrigerated containers potentially driving retrofitting costs or early asset obsolescence risks requiring continued R&D vigilance [S12].
- Cybersecurity threats targeting IT infrastructure crucial for transaction tracking and billing pose reputational hazards should breaches occur given heavy reliance on proprietary systems managing over seven million TEUs globally [S12].
- Interest rate volatility impacting refinancing costs notwithstanding active derivative hedging programs designed to limit earnings volatility associated with floating rate debt instruments [S15].
- Legal risks typical for global operators arising from disputes or regulatory investigations related to equipment use or compliance matters detailed in contingent liabilities sections [S23].
This report is intended solely for informational purposes reflecting data available as of early 2026 without any investment recommendations or advice regarding securities transactions involving Triton International Ltd or its financial instruments. Readers should perform further due diligence before making any decisions.
Disclaimer: This is research-only, informational analysis and not investment advice. It may include AI-generated interpretation and general industry context. Always verify important details using primary sources.
Comments