
U S Physical Therapy’s Expanding Clinic Network Drives Revenue Growth Despite Regulatory and Reimbursement Risks
The company leverages its clinic partnerships and industrial injury prevention services for steady top-line expansion, navigating evolving healthcare regulations.
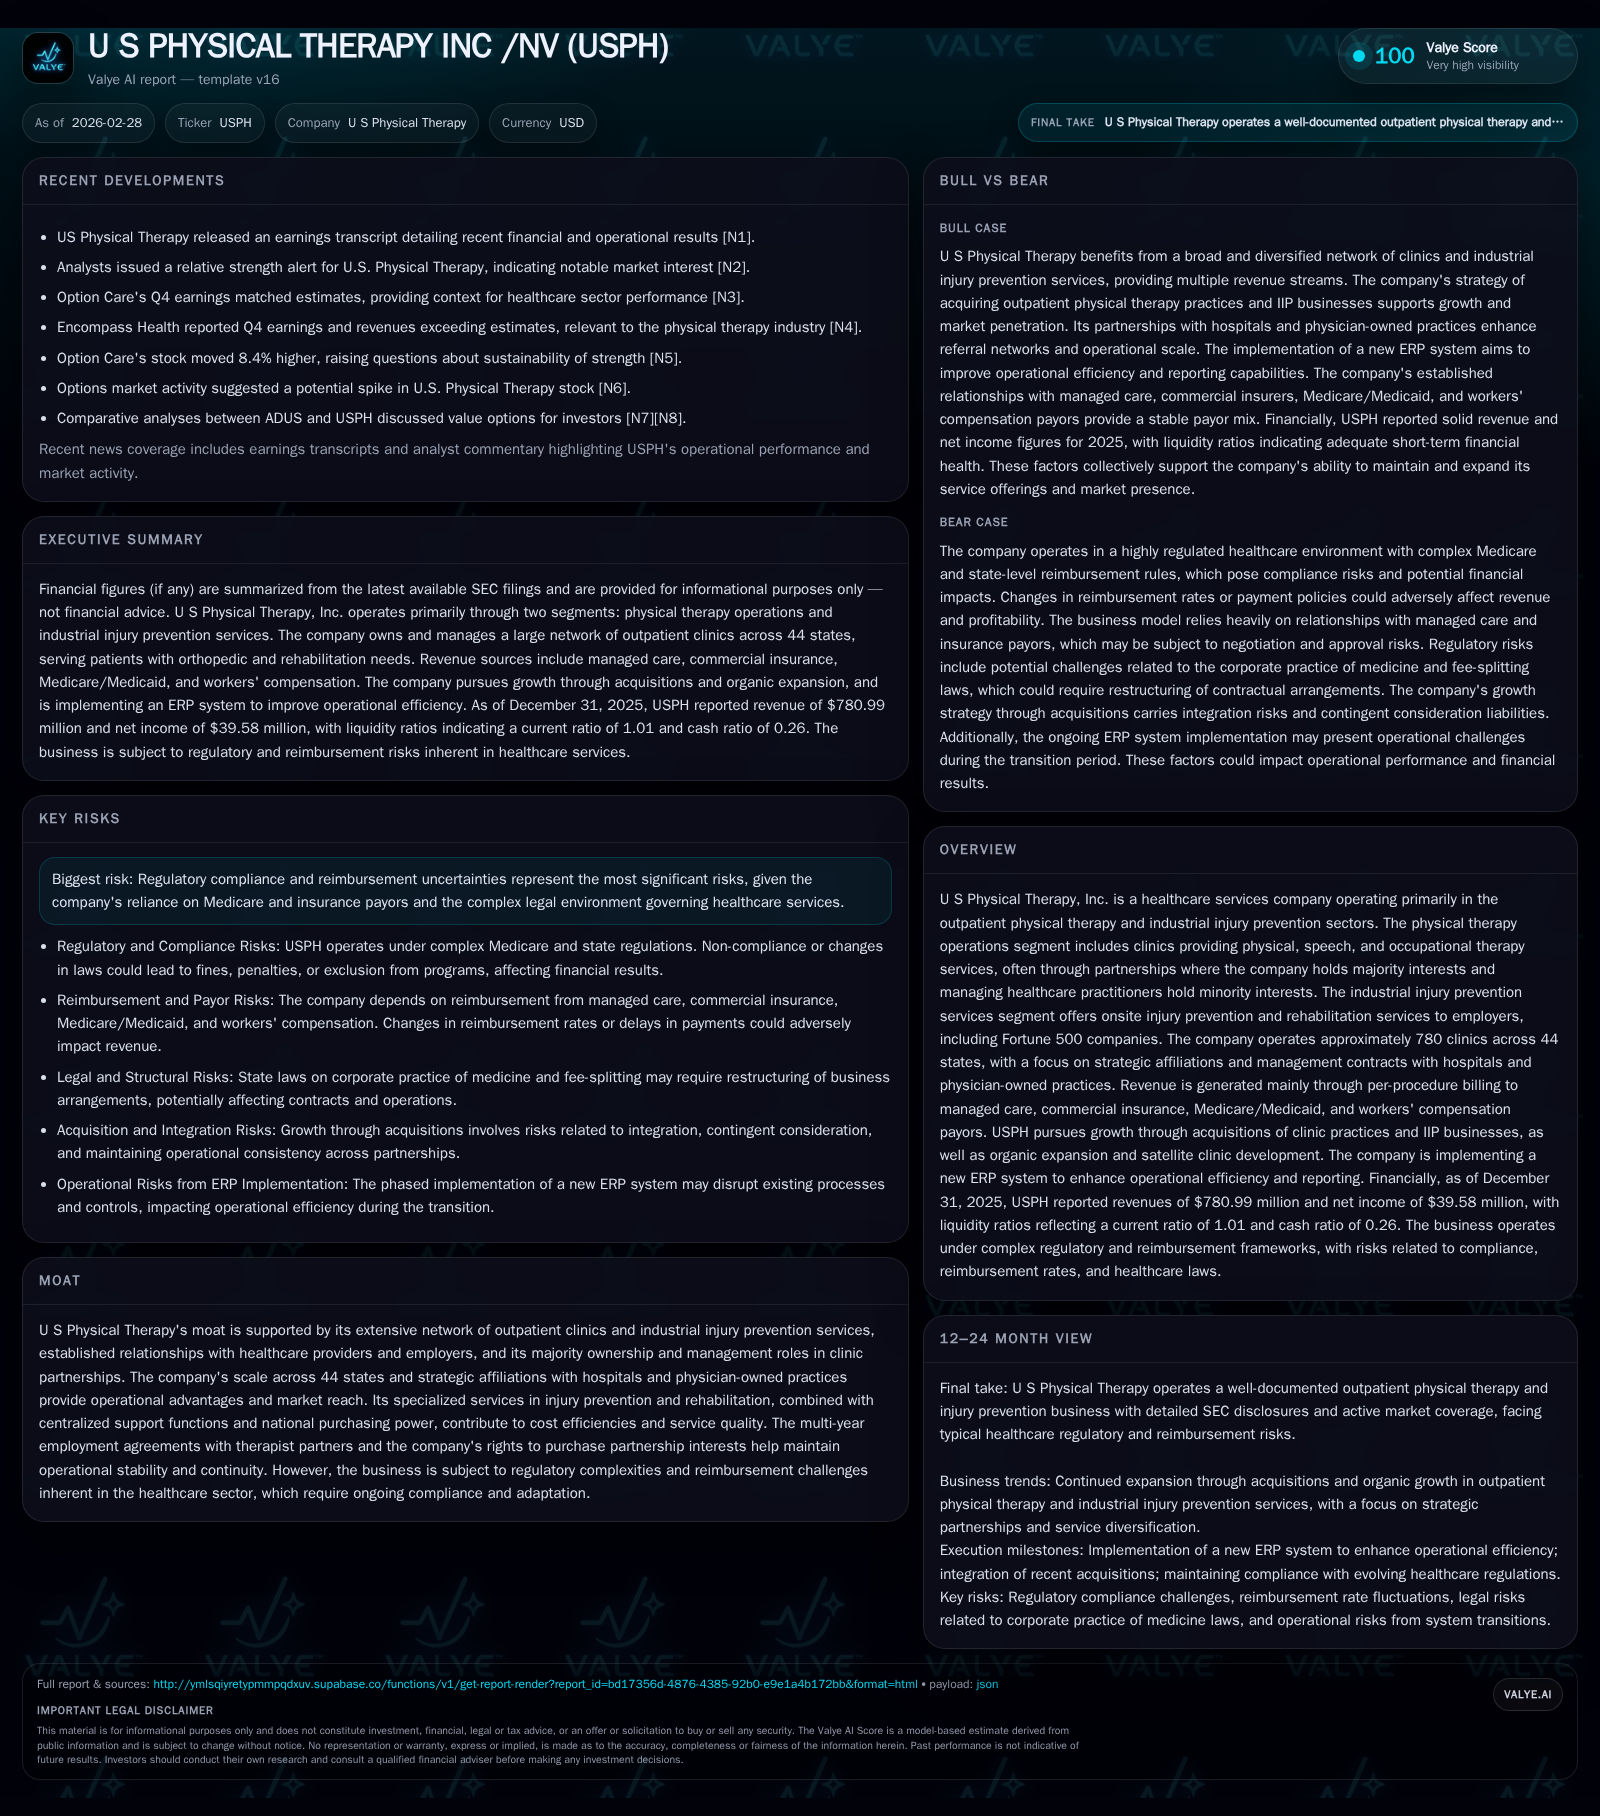
U S Physical Therapy, Inc. (USPH) has demonstrated robust revenue growth over the past four years, driven by strategic acquisitions and expanding outpatient therapy services across 44 states. The company’s partnership model with local therapist-owners remains a key competitive advantage, supporting operational stability and market reach. However, USPH faces ongoing risks related to regulatory compliance, Medicare reimbursement rates, and reimbursement retroactive adjustments that could impact margins. While operating income and net income margins improved noticeably in 2025, cash flows remained stable amid increased capital expenditures. Future growth depends on navigating complex healthcare regulations, sustaining favorable reimbursement rates, and continued successful integration of acquisitions.
Company Overview
U S Physical Therapy, Inc. (USPH) is a healthcare services provider specializing in outpatient physical therapy as well as industrial injury prevention services (IIP). Operating through approximately 780 clinics spanning 44 states [S1][S15], USPH serves patients primarily via partnerships where it holds majority ownership stakes while healthcare practitioners retain minority ownership interests. This structure fosters strong alignment with local therapists who help oversee clinic operations and patient care quality.
The physical therapy segment delivers rehabilitative services including physical, speech, and occupational therapies targeting orthopedic conditions, sports injuries, post-operative recovery, and injured workers' rehabilitation [S1]. Meanwhile, the industrial injury prevention segment primarily contracts with employers directly — including Fortune 500 companies — providing onsite injury prevention, rehabilitation programs, functional capacity evaluations, ergonomic assessments, and employment testing services executed by specialized professionals [S1].
Revenue streams derive from third-party payors such as managed care organizations, commercial insurers, Medicare/Medicaid programs (~36% of revenues), and workers' compensation payors [S18]. Services are mostly reimbursed through per-procedure billing aligned with Medicare Physician Fee Schedule guidelines among other payer-specific arrangements.
Historical Performance
USPH has posted consistent top-line expansion over the last four years fueled by new clinic openings and strategic acquisitions along with some organic volume growth. Financial highlights include:
Historical performance (annual)
| FY | Rev ($mm) | Net ($mm) | CFO ($mm) | OpInc ($mm) | Rev YoY | Net YoY |
|---|---|---|---|---|---|---|
| 2025 | 781 | 40 | 75 | 87 | +16.3% | +26.0% |
| 2024 | 671 | 31 | 75 | 63 | +11.0% | +11.3% |
| 2023 | 605 | 28 | 82 | 52 | +9.3% | -12.2% |
| 2022 | 553 | 32 | 59 | 57 |
Source: SEC companyfacts cache [F1].
Capital returns and efficiency (annual)
| FY | Div ($mm) | FCF ($mm) | ROE% |
|---|---|---|---|
| 2025 | 27 | 61 | 8.3 |
| 2024 | 27 | 66 | 6.4 |
| 2023 | 24 | 73 | 5.9 |
| 2022 | 21 | 50 | 10.2 |
Source: SEC companyfacts cache [F1].
Source: [F1]
The most notable accelerations occurred in fiscal year (FY) 2025 where revenue grew robustly by over sixteen percent while operating income jumped an even stronger ~37%, benefiting from expanded scale and improved clinic throughput [F1]. Net income similarly rose by roughly one quarter compared to the prior year despite challenges posed by rising operating expenses including labor costs common in the medical staffing sector.
Operating cash flow remained largely flat versus the prior year near $75 million despite significantly higher capital spending (+53%), reflecting investments likely related to clinic buildouts or technology improvements aiming at efficiency or compliance support [F1]. Dividend payments rose steadily reflecting confidence in underlying cash generation while no meaningful share repurchase activity has occurred since at least FY2013.
Equity stood at approximately $476 million at the end of FY2025 with an implied return on equity (ROE) around eight percent based on net income generation — typical for healthcare services entities balancing regulated reimbursement structures against capital investment needs [F1].
Business Model & Competitive Advantages
USPH’s model centers on decentralized clinic operations coupled with centralized support functions such as billing compliance and purchasing power leveraged at scale [S1]. This multi-state network enables cost efficiencies through national vendor contracts while maintaining close ties between therapist-owners and local referral sources (physicians mainly). These ownership alignments facilitate patient care continuity and provide competitive barriers through entrenched community relationships.
The industrial injury prevention division further diversifies revenue beyond traditional physical therapy payors by contracting directly with employers for workplace injury programs—a niche requiring specialized clinical expertise but offering more predictable contracting environments [S1]. This complements their main clinic-based outpatient business enabling broader service offerings to corporate clients.
Partnership agreements typically involve multi-year employment commitments from therapists alongside USPH’s rights to acquire minority interests helping mitigate turnover risk while supporting steady clinic performance [S1]. These features collectively form a moat based on scale economies combined with clinician-driven operational stability.
Regulatory & Legal Risks
As a provider heavily reliant on Medicare/Medicaid reimbursements (36% of revenues), USPH faces intrinsic risk from periodic government policy shifts affecting fee schedules and payment rules [S1][S18]. While reimbursement rates under the Medicare Physician Fee Schedule are expected to modestly increase (1.75%) for services rendered in FY2026 compared to FY2025, historical volatility remains a concern [S1]. Any unfavorable changes such as fee cuts could compress profitability materially given tight reimbursement margins.
Moreover, the complexity of coding rules exposes the company to risk of retroactive payment adjustments following audits or reviews conducted by federal/state payors or managed care organizations [S13][S18][S24]. These clawbacks can impose significant financial strain alongside administrative costs related to investigations or compliance efforts.
USPH acknowledges exposure to potential enforcement actions under statutes like the federal False Claims Act which permits qui tam lawsuits alleging improper billing practices; such litigation can result in costly fines and reputational harm even absent intent to defraud [S4][S6][S7][S10][S22][S24]. Notably their risk disclosures underscore prior involvement in similar actions reiterating ongoing vulnerability inherent in healthcare billing environments.
Staffing lease arrangements involving referring physicians pose additional scrutiny risks based on evolving Office of Inspector General guidance aimed at preventing improper remuneration schemes that may violate Fraud and Abuse Laws or Stark Law prohibitions [S6][S16][S22]. Thus legal oversight remains intense requiring strict compliance protocols across USPH’s complex partnership arrangements.
Financial Position & Capital Allocation
At year-end FY2025 USPH reported total assets exceeding $1.19 billion supported by goodwill ($690 million), intangible assets ($176 million), operating lease right-of-use assets (~$140 million), plus tangible fixed assets totaling around $34 million net [F1][S11]. Liabilities aggregate around $414 million excluding substantial redeemable non-controlling interest components indicating significant minority partners within their subsidiaries needing careful balance sheet monitoring [F1]
The company carries debt obligations including term loans and revolving credit facilities subject to financial covenants limiting incremental borrowings or restructuring flexibility; current ratio is approximately one indicating working capital is balanced but not excessive [F1][S8][S9][S14][S27][S28]. Liquidity appears adequate but constrained relative to growth ambitions or unexpected financial stress scenarios.
Capital allocation has prioritized dividend distributions which increased each year from ~$21 million in FY2022 to ~$27 million in FY2025 while share repurchases remain dormant implying management preference for rewarding shareholders with steady income streams rather than aggressive buyback programs amid regulatory uncertainties [F1][S17][S25].
Investments into property & equipment noticeably rose during fiscal 2025 signaling continued emphasis on facility upgrades or expansions aligning with long-term network growth strategies though FCF after capex stands at about $61 million supporting these initiatives comfortably without detracting from dividend capacity [F1].
Future Growth Prospects & Considerations
Growth prospects for USPH hinge primarily on several factors:
- Continued expansion via selective acquisitions adding clinics or IIP businesses as evidenced by multiple acquisitions since early/mid-2024 detailed in filings [S1]. These deals extend geographic footprint or service depth which underpins sustained revenue growth shown recently.
- Organic growth driven by increased utilization rates reflecting demographic trends such as aging populations requiring more outpatient rehabilitative care combined with employer demand for preventive occupational health interventions [N1]
- Stability or improvement of reimbursement rates particularly Medicare’s Physician Fee Schedule governs much of underlying revenue potential; delays or reductions here represent major downside risks noted explicitly by management [S1,S13]
- Regulatory environment vigilance given ongoing government enforcement activity targeting healthcare providers’ billing practices; successful navigation requires continuous compliance investments impacting operating cost structures otherwise risking material penalties or exclusion from programs diminishing access to large patient pools [S4,S13,S18]
- Integration risks associated with acquired clinics maintaining quality standards while achieving operational synergies remain important line items affecting future margin development.
- Management changes such as recent CFO resignation announced February ’26 could influence execution cadence though no immediate issues flagged publicly so far [N3]
Absent explicit guidance disclosed publicly through official releases or filings post-FY2025 close ([N1],[N3],[N4],[S3]), key milestones warrant monitoring around updates from CMS regarding Medicare rules for outpatient therapy services typically issued annually potentially affecting next fiscal year outcomes.
Conclusion
U S Physical Therapy maintains a leading position within the fragmented U.S outpatient rehabilitation market leveraging a broad multi-state clinic network combined with complementary industrial injury prevention operations serving corporate customers besides traditional public/government health payors.
Its growth trajectory over several years reflects both accretive acquisitions expanding service capacity/footprint alongside steady organic increases driven by demographic tailwinds; operational efficiencies contributed to disproportionate rises in operating profit relative to revenue gains most recently.
However regulatory complexity compounded by dependence on government payor reimbursement policies poses persistent risk normal to this industry segment requiring sustained internal diligence ensuring compliance along with strategic flexibility adapting rapidly if reimbursement models evolve unfavorably.
The firm balances moderate leverage loads cautiously allocating capital towards dividends rewarding shareholders while investing sufficiently into clinic infrastructure supporting future clinical volume growth.
Monitoring evolving legislative/regulatory developments affecting Medicare reimbursement rates alongside audits linked to billing accuracy remains crucial given potential material impacts highlighted extensively by management disclosures emphasizing contingent liabilities related thereto.
Disclaimer: This analysis is based solely on information available as of February 28, 2026 from SEC filings and publicly accessible news sources without any forward-looking projections beyond those explicitly stated within such documents.
Disclaimer: This is research-only, informational analysis and not investment advice. It may include AI-generated interpretation and general industry context. Always verify important details using primary sources.
Comments