
UWM Holdings Strengthens Loan Production and Servicing Income in Q1 2026
UWM's Q1 2026 results underscore robust growth in loan production income and servicing revenue, affirming the strength of its wholesale-only mortgage lending model.
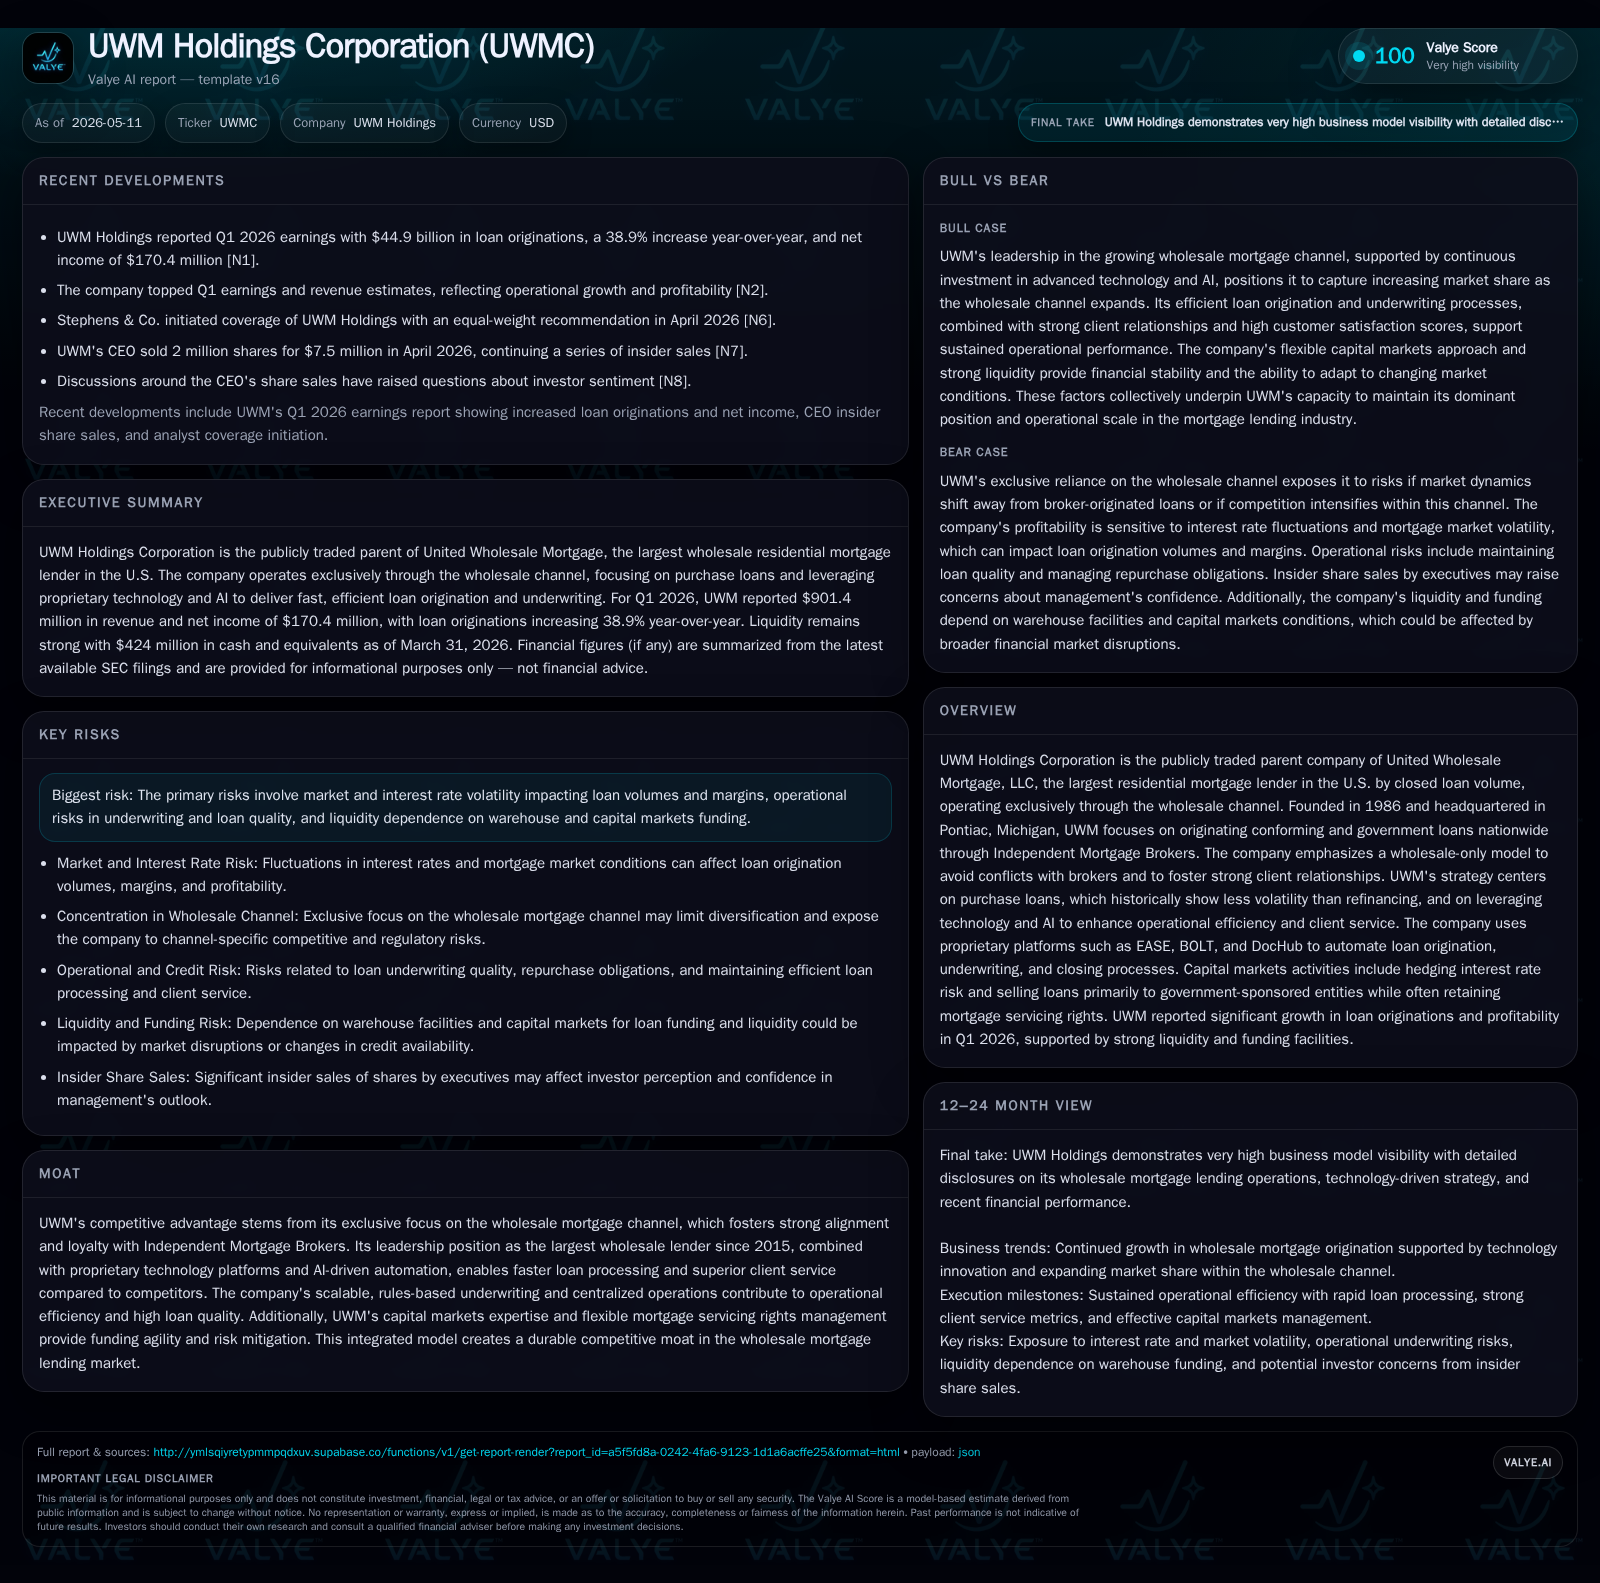
In Q1 2026, UWM Holdings Corp demonstrated strong operational momentum with an 82% increase in loan production income to approximately $555 million and a 12% rise in loan servicing income. These gains reflect wider gain margins driven by efficient loan origination processes and strategic MSR portfolio management. The company’s exclusive focus on the wholesale mortgage channel, bolstered by proprietary technology and capital markets agility, continues to solidify its leading market position and competitive moat amid a challenging interest rate environment.
First Quarter Operating Performance Highlights
UWM Holdings Corp’s first quarter 2026 operating results, as reported in their May 11, 10-Q filing [S2], reveal a pronounced rebound spearheaded by loan production income, which posted an impressive 82% year-over-year jump to approximately $554.6 million. This uplift was primarily driven by the gain margin expansion from 0.94% a year earlier to 1.23%, underscoring enhanced pricing power despite fluctuating rate environments. Loan origination fees climbed sharply by over 42%, reflecting not only increased volume but also improved fee capture from brokers.
Simultaneously, loan servicing income grew by about 12%, reaching $213.4 million for the quarter—a sign of expanding retained servicing rights (MSRs) portfolio size and higher average servicing fees due to optimization of executed servicing contracts [S2]. The reduction in provisions for representation and warranty obligations (down nearly half from the prior year) further contributed positively to net production profitability.
These results were accompanied by a substantial increase in primary loss on loans held for sale (-$700.6 million versus -$532.7 million prior-year quarter), attributable largely to mark-to-market changes related to hedged interest rate lock commitments (IRLCs) and fair value adjustments inherent in pipeline risk management.
UWM’s Wholesale-Only Business Model and Competitive Moat
UWM’s business model is distinct within the residential mortgage landscape due to its singular wholesale-only origination focus—operating strictly through Independent Mortgage Brokers rather than retail branches [S1,S2]. This approach circumvents channel conflict with brokers who possess direct borrower relationships, enhancing broker loyalty and retention.
The company’s dominant position as the largest wholesale lender in the U.S. since 2015 reflects this aligned incentive structure combined with scalable operational execution [S1]. Proprietary technology platforms like EASE (for processing), BOLT (underwriting), and DocHub (document automation) underpin UWM's ability to quickly process loans with greater accuracy under consistent rules-based criteria. These platforms collectively support concurrent multi-team access on loans with automated deficiency alerts—streamlining closures while maintaining high credit quality standards.
Capital markets expertise forms another pillar of UWM’s moat; sophisticated hedging strategies on IRLCs and floating-rate floor securities (FLSCs), along with flexible warehouse funding facilities, enable nimble risk management even amid volatile interest rates [S1]. The ability to opportunistically sell Mortgage Servicing Rights (MSRs) based on market conditions provides further funding agility.
Market Structure: Wholesale Lending Dynamics and Industry Positioning
Within the broader residential mortgage industry, UWM is notable for its near-total reliance onWholesale distribution via independent brokers rather than retail direct sales [S1]. Approximately 94% of its originated loans are conforming or government-backed (FHA, USDA, VA) loans subsequently sold or securitized through Fannie Mae, Freddie Mac or Ginnie Mae pools [S2]. This concentration underpins relative credit quality stability since these agencies impose stringent underwriting criteria.
Non-agency jumbo loans and non-qualified mortgages constitute a smaller portion but adhere largely to similar Qualified Mortgage underwriting standards [S2]. Pricing pressure is typical across wholesale lenders due to broker commission dynamics; however, UWM mitigates this through technology-driven efficiency gains that reduce turnaround times and error rates—key competitive attributes when brokers evaluate lender partners.
Regulatory frameworks mandating qualified mortgage standards also reinforce consistent underwriting discipline across UWM’s product mix [S1], limiting exposure to riskier credit segments.
Growth Drivers: Purchase Loan Focus, Technology Innovation, and Capital Flexibility
Strategically emphasizing purchase loan originations over refinancing has insulated UWM somewhat from typical interest-rate-driven volume swings caused by refinancing collapses at elevated rates [S1]. Purchase mortgages generally exhibit lower cyclicality since homebuyer demand depends more on demographic/social factors than transient rate moves.
UWM continues investing heavily in AI-enabled tools embedded within its platforms that reduce manual intervention and permit accelerated underwriting throughput at scale [S1,S2]. These technological innovations enhance broker satisfaction by shortening cycle times while maintaining credit standards.
On the capital front, UWM expanded its Ginnie Mae MSR Facility borrowing capacity from $500 million to $900 million in March 2026 via an amendment extending draw periods through 2028 and maturity into early 2029 [S3,S5]. This added facility flexibility supports increased retention of MSRs—which generate recurring servicing fee revenue—and offers balance sheet agility for managing interest rate risk exposure.
The company’s nimble approach toward buying back loans from warehouse lenders prior to pooling or selling into the secondary market facilitates optimized timing for MSR retention or sale depending on market liquidity [S1].
Risks and Constraints: Interest Rate Volatility, Funding Liquidity, and Underwriting Quality
Chief risks facing UWM involve significant interest rate volatility effects depressing refinance volumes—traditionally more sensitive than purchase activities—and pressuring margins via widening bid-ask spreads reflected in primary loss fluctuations [S1,S2,S26]. Notably, the primary loss widened substantially this quarter (-$700 million vs -$533 million prior-year), reflecting mark-to-market valuation swings related both to pipeline duration risk hedges and fair value estimations.
Liquidity considerations remain critical given UWM’s approximately $3 billion total debt balance against cash & equivalents around $424 million as of March-end [F1], resulting in net debt approximating $2.58 billion. Ongoing macro uncertainties necessitate continued close monitoring of funding sources.
Operational risks around rapid volume scaling also exist—primarily concerning underwriting consistency despite automated rulesets—to prevent deterioration in loan quality.
What to Monitor Next: Volume Trends, Margin Signals, and MSR Market Movements
Key near-term indicators include second-quarter guidance on total origination volumes particularly purchase mortgages as consumer buying sentiment evolves amid fluctuating financing costs [N1,N2,S2]. Analysts will scrutinize gain margin developments given their outsized leverage on profitability amidst changing hedging cost structures.
Secondary market activity regarding MSRs—whether retention increases or opportunistic bulk sales—is another important barometer for capital deployment strategy [S3]. Equally significant will be scheduled disclosures around technology platform enhancements affecting broker engagement metrics such as application submission speed and error reduction rates.
Close attention should also be paid to any commentary addressing warehouse facility utilization ratios or renewed amendments/extensions providing borrowing room—critical signals of liquidity resilience [S3,S5].
Latest Financial Snapshot: Liquidity, Debt, Profitability Metrics
Latest financial snapshot
| Metric | Value | Period |
|---|---|---|
| Cash & equivalents | $424mm | |
| 2026-03-31 | ||
| Total debt | $3.0bn | |
| 2026-03-31 | ||
| Net debt | $2.6bn | |
| 2026-03-31 | ||
| Current ratio | 0.05x | |
| 2026-03-31 |
Source: SEC companyfacts cache [F1].
This snapshot highlights strong cash reserves supporting operational needs alongside sizeable leverage primarily related to warehouse funding for originations. The notable gain margin expansion contributes materially to improved unit economics while servicing income growth validates scale benefits within retained MSRs agencies portfolios.
Disclaimer: This analysis is based purely on disclosed data from official SEC filings up to May 11th, 2026 ([S1],[S2],[S3],[F1]) without forward-looking investment advice or numerical forecasting beyond stated facts.
Disclaimer: This is research-only, informational analysis and not investment advice. It may include AI-generated interpretation and general industry context. Always verify important details using primary sources.
Comments