
Virco Mfg’s Fiscal 2026 Earnings Reflect Market Cyclicality and Cost Pressures
Virco Mfg Corporation reported significant declines in operating results for fiscal 2026 amid seasonal demand shifts, macroeconomic uncertainty, and raw material cost volatility.
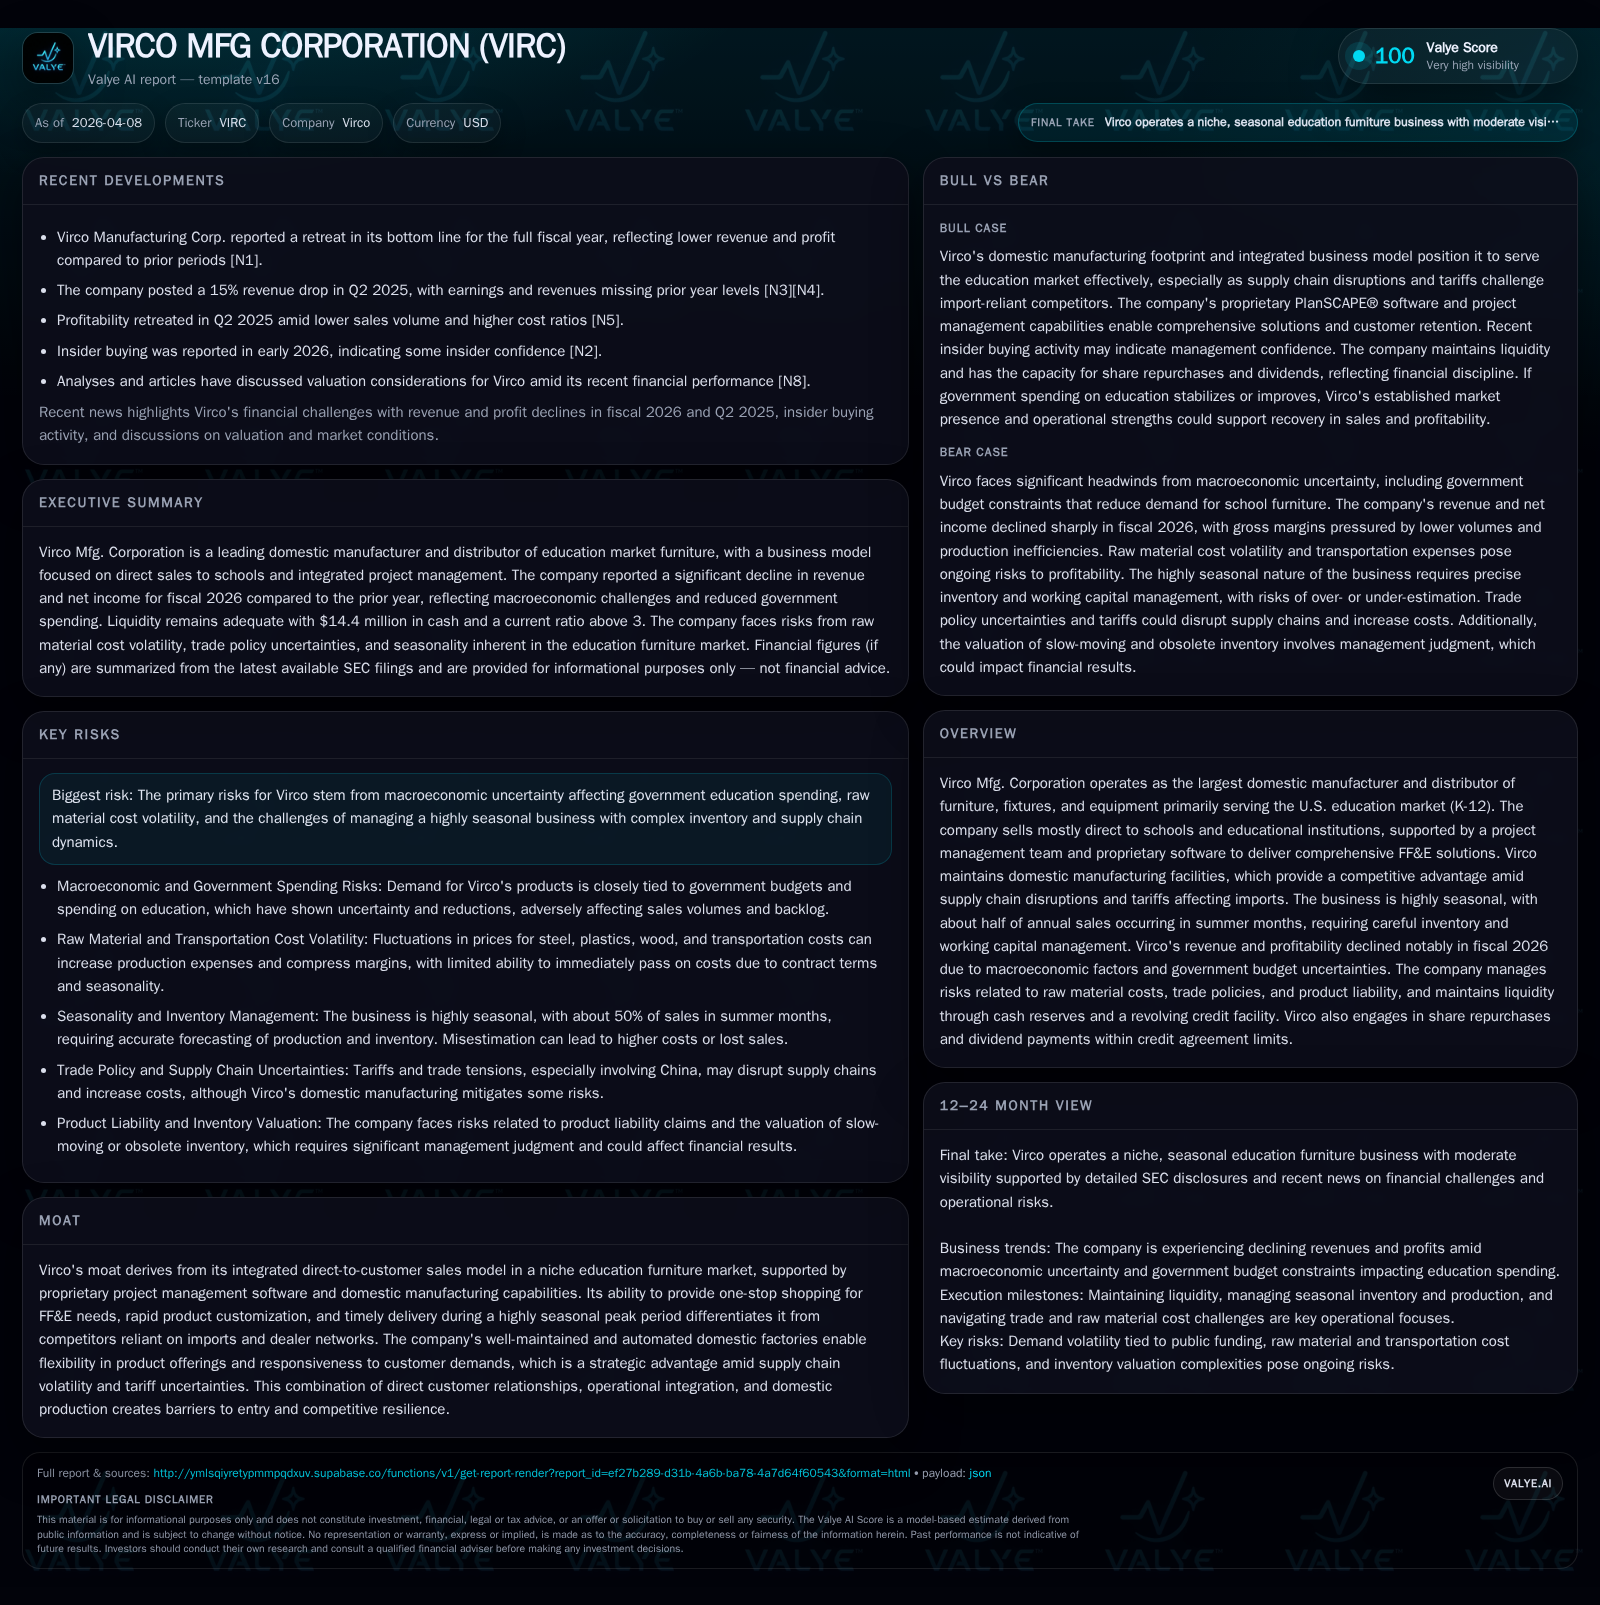
Virco Mfg Corporation, the largest U.S. domestic manufacturer of K-12 education furniture, saw an 87% decline in operating income in fiscal 2026 compared to the prior year, driven by reduced governmental spending confidence and absence of prior disaster recovery orders. The firm’s direct sales model supported by proprietary project management software and domestic production advantages remains a key competitive factor. However, raw material cost increases and supply chain complexities continue to pressure margins within a highly seasonal revenue profile. Operating cash flows turned negative in fiscal 2026, with capital expenditures maintained toward automation and new product development. Virco manages financial liquidity prudently, maintaining compliance with bank covenants while continuing dividends and share repurchases.
Business Model and Competitive Positioning
Virco Manufacturing Corporation is the largest domestic manufacturer and distributor of furniture, fixtures, and equipment (FF&E) primarily serving the K-12 education market in the United States [S1]. Unlike many peers reliant on imported goods or dealer networks, Virco sells directly to schools with approximately 75%–85% of sales made direct rather than through intermediaries [S1]. This direct-to-customer approach is enabled by an integrated business model featuring proprietary PlanSCAPE® software that supports detailed classroom-by-classroom product specification, pricing, delivery planning, and turnkey setup—complemented by internal project management teams including interior designers and purchasing specialists [S1,S18].
A key competitive advantage is Virco's fully domestic manufacturing footprint retained since China's WTO entry in 2001 when many competitors offshored production [S1,S18]. These facilities are highly automated yet well-maintained despite being largely depreciated. Domestic production mitigates risks related to tariffs, ocean freight volatility, and supply chain disruptions exacerbated during recent years including COVID-19 effects. Additionally, the bulky nature of educational furniture underscores the advantage of local fabrication versus reliance on imports [S1,S18].
Historical Financial Performance
Recent years have seen variable performance influenced by pandemic disruptions followed by recovery phases and one-time disaster recovery orders:
Historical performance (annual)
| FY | Net ($mm) | CFO ($mm) | OpInc ($mm) | Capex ($mm) | Net YoY |
|---|---|---|---|---|---|
| 2026 | 3 | -1 | 4 | 6 | -88.1% |
| 2025 | 22 | 33 | 28 | 6 | -1.2% |
| 2024 | 22 | 27 | 32 | 5 | +32.4% |
| 2023 | 17 | -4 | 11 | 3 |
Source: SEC companyfacts cache [F1].
Capital returns and efficiency (annual)
| FY | Div ($) | Buybacks ($mm) | FCF ($mm) |
|---|---|---|---|
| 2026 | 1576000 | 4 | -7 |
| 2025 | 1463000 | 4 | 27 |
| 2024 | 327000 | 0 | 22 |
| 2023 | 0 | -7 |
Source: SEC companyfacts cache [F1].
Note: Revenue data is not explicitly disclosed in source documents.
The sharp decline in operating income between FY25 and FY26 strongly correlates with the absence of approximately $23 million in disaster recovery contracts fulfilled late FY24 into early FY25 [S1,S2]. Those orders temporarily inflated top-line figures and improved overhead absorption, accounts receivable turnover, collections, and inventory reductions [S1,S2]. In contrast, FY26 saw order rates fall about a quarter relative to the prior year due mainly to government education budget uncertainties amid a challenging macroeconomic environment [N1,S2].
Margins have faced pressure from rising raw material costs including steel, plastics such as polyethylene and polypropylene, plywood, particleboard, and packaging materials—cost increases that cannot always be immediately passed on due to multi-year contract pricing typical in government-funded projects [S1]. The Company mitigates input cost volatility through sourcing efforts, product re-engineering, and negotiated price escalations on future orders where possible but timing mismatches remain a risk.
Seasonality remains a defining feature: typically about half of annual sales concentrate in June through August coinciding with school summer breaks—requiring hiring of temporary labor for production spikes during this period [S1,S2,S22]. This seasonality drives significant inventory build-up ahead of peak months demanding careful working capital management.
Growth Outlook
Looking beyond FY26's performance, growth depends heavily on public school funding primarily sourced from state and local governments—estimated at over 85% for public schools—and bond markets financing new construction or refurbishments underpinning FF&E demand [S2]. Management notes pandemic-era order volumes likely overstated long-term growth expectations; normalized single-digit growth rates are anticipated barring unexpected large funding surges or disaster recovery needs.
Investment in factory automation along with enhancements to PlanSCAPE® software aim to maintain competitive positioning through flexible customization capabilities and operational efficiencies [S12]. Ongoing tooling innovation aligned with new product development addresses evolving customer preferences for durable yet ergonomic furnishings suited for modern classrooms.
Challenges include continued raw material cost volatility compounded by tight labor markets that may constrain production scalability during peak seasons despite historical ability to ramp temporary workforce rapidly via wage incentives post-COVID disruptions [S1,S2]. Federal trade policy changes could also influence supply chain cost structures.
Milestones / What To Monitor
The Company has not issued specific near-term revenue or margin guidance but emphasizes monitoring incoming order rates closely throughout Q2 when major summer season purchase decisions typically solidify [N1,S2]. Backlog stood near $26 million entering Q4 FY26—slightly below prior year—consistent with softer demand outlooks but sufficient inventory readiness supports delivery schedules without noted excess carryover risk currently [S2].
Key indicators include:
- Changes in government education funding allocations or bond issuances enabling large new projects.
- Raw material input cost trends impacting margin dynamics.
- Progress integrating automation upgrades without disruption.
- Inventory turnover relative to seasonal order flow signaling working capital balance.
- Usage patterns of revolving credit facility reflecting cash flow cycles.
Capital Allocation & Returns
Despite profit contractions resulting in a modest return on equity (~2.4% calculated as net income over equity for FY26), Virco sustained steady dividend payments totaling $1.58 million while maintaining active share repurchases amounting to $4 million aimed at enhancing per-share metrics without overly stressing liquidity amid negative operating cash flow conditions encountered this cycle [F1,S9,S14].
Operating cash flow reversed into negative territory at -$0.84 million after strong positive trends exceeding $33 million prior year due primarily to lower earnings coupled with adverse accounts payable movements illustrating the criticality of tight working capital management amid volatile revenue timing [F1,S20]. Capital expenditures remained at a reasonable level around $5.85 million focusing primarily on factory automation investments plus software enhancements designed for sustainable efficiency gains rather than expansionary growth capex—aligned with cautious outlooks under current macro uncertainties [F1,S12,S21].
Virco accesses revolving credit lines sized seasonally at roughly $60-$70 million (recently reduced following amendments) from PNC Bank secured against accounts receivable and inventory collateral designed specifically for peak summer cash demands; notably no borrowings were outstanding at FY26 year-end reflecting conservative liquidity management under diminished cash flows [S4–S11,S23]. The credit facility includes covenants mandating minimum fixed charge coverage ratios designed to preserve financial flexibility which management expects to meet based on current forecasts despite risks linked chiefly to raw material fluctuations affecting margins.
Operational Highlights & Risks
Operating capacity utilization fluctuates markedly between peak seasonal quarters: personnel runs near full utilization including overtime temporary labor additions while off-peak periods see reduced workforce hours though fixed plant capacities result in structural underutilization during slow seasons—a model imposing fixed cost leverage challenges exacerbating margin pressures amid volume slumps [S22]. Distribution relies heavily on third-party freight carriers managing bulky heavy furniture shipments requiring place-in-classroom installations under binding bond-funded contract deadlines.
Primary risks include macroeconomic uncertainty impacting state/local education infrastructure budgets; commodity price swings affecting input costs; potential trade policy shifts altering cost bases; labor availability constraints especially for skilled temporary workers critical during concentrated shipping windows; product liability exposures managed through insurance retentions capped at defined amounts reinforced by aggressive quality controls limiting claim risks; contingent liabilities limited through self-insurance layers augmented by commercial coverage up to $30 million reported as manageable within current reserves policies [S1,N1].
Summary Assessment
Virco Manufacturing stands out as a niche specialist leveraging vertically integrated domestic manufacturing combined with direct customer engagement technologies tailored for the fragmented K-12 furniture market—a strategic positioning yielding operational resilience amid supply chain shocks uncommon among import-reliant peers.
FY26 illustrated stark top-line contraction tied closely to discretionary government spending patterns exacerbated by economic headwinds alongside stiff input cost inflation compressing profitability sharply relative to recent years partially insulated previously by disaster recovery orders.
Financially strained operating cash flows underscore the importance of vigilant working capital controls given extreme seasonality driving bulk upfront investments preceding major revenue recognition periods concentrated midyear.
Capital deployment shows balanced stewardship emphasizing modernization investments alongside thoughtful shareholder return policies sustaining dividends plus opportunistic buybacks calibrated responsively amid current earnings variability.
Market observers should weigh Virco’s commitment to maintaining its domestic manufacturing edge augmented by proprietary IT assets against structural cyclicality inherent within education FF&E demand cycles while monitoring governmental funding developments pivotal for medium-term recovery trajectories.
This analysis is prepared solely for informational purposes based on reviewed filings dated April 8th, 2026 or earlier; it does not constitute an offer or recommendation regarding securities trading or investment decisions.
Disclaimer: This is research-only, informational analysis and not investment advice. It may include AI-generated interpretation and general industry context. Always verify important details using primary sources.
Comments