
Verastem’s 2025 Step-Up: Evaluating Growth, Loss Control, and Cash Strategy
Verastem’s revenues surged in 2025 while operating losses widened, spotlighting the biotech’s commercialization and cash management challenges.
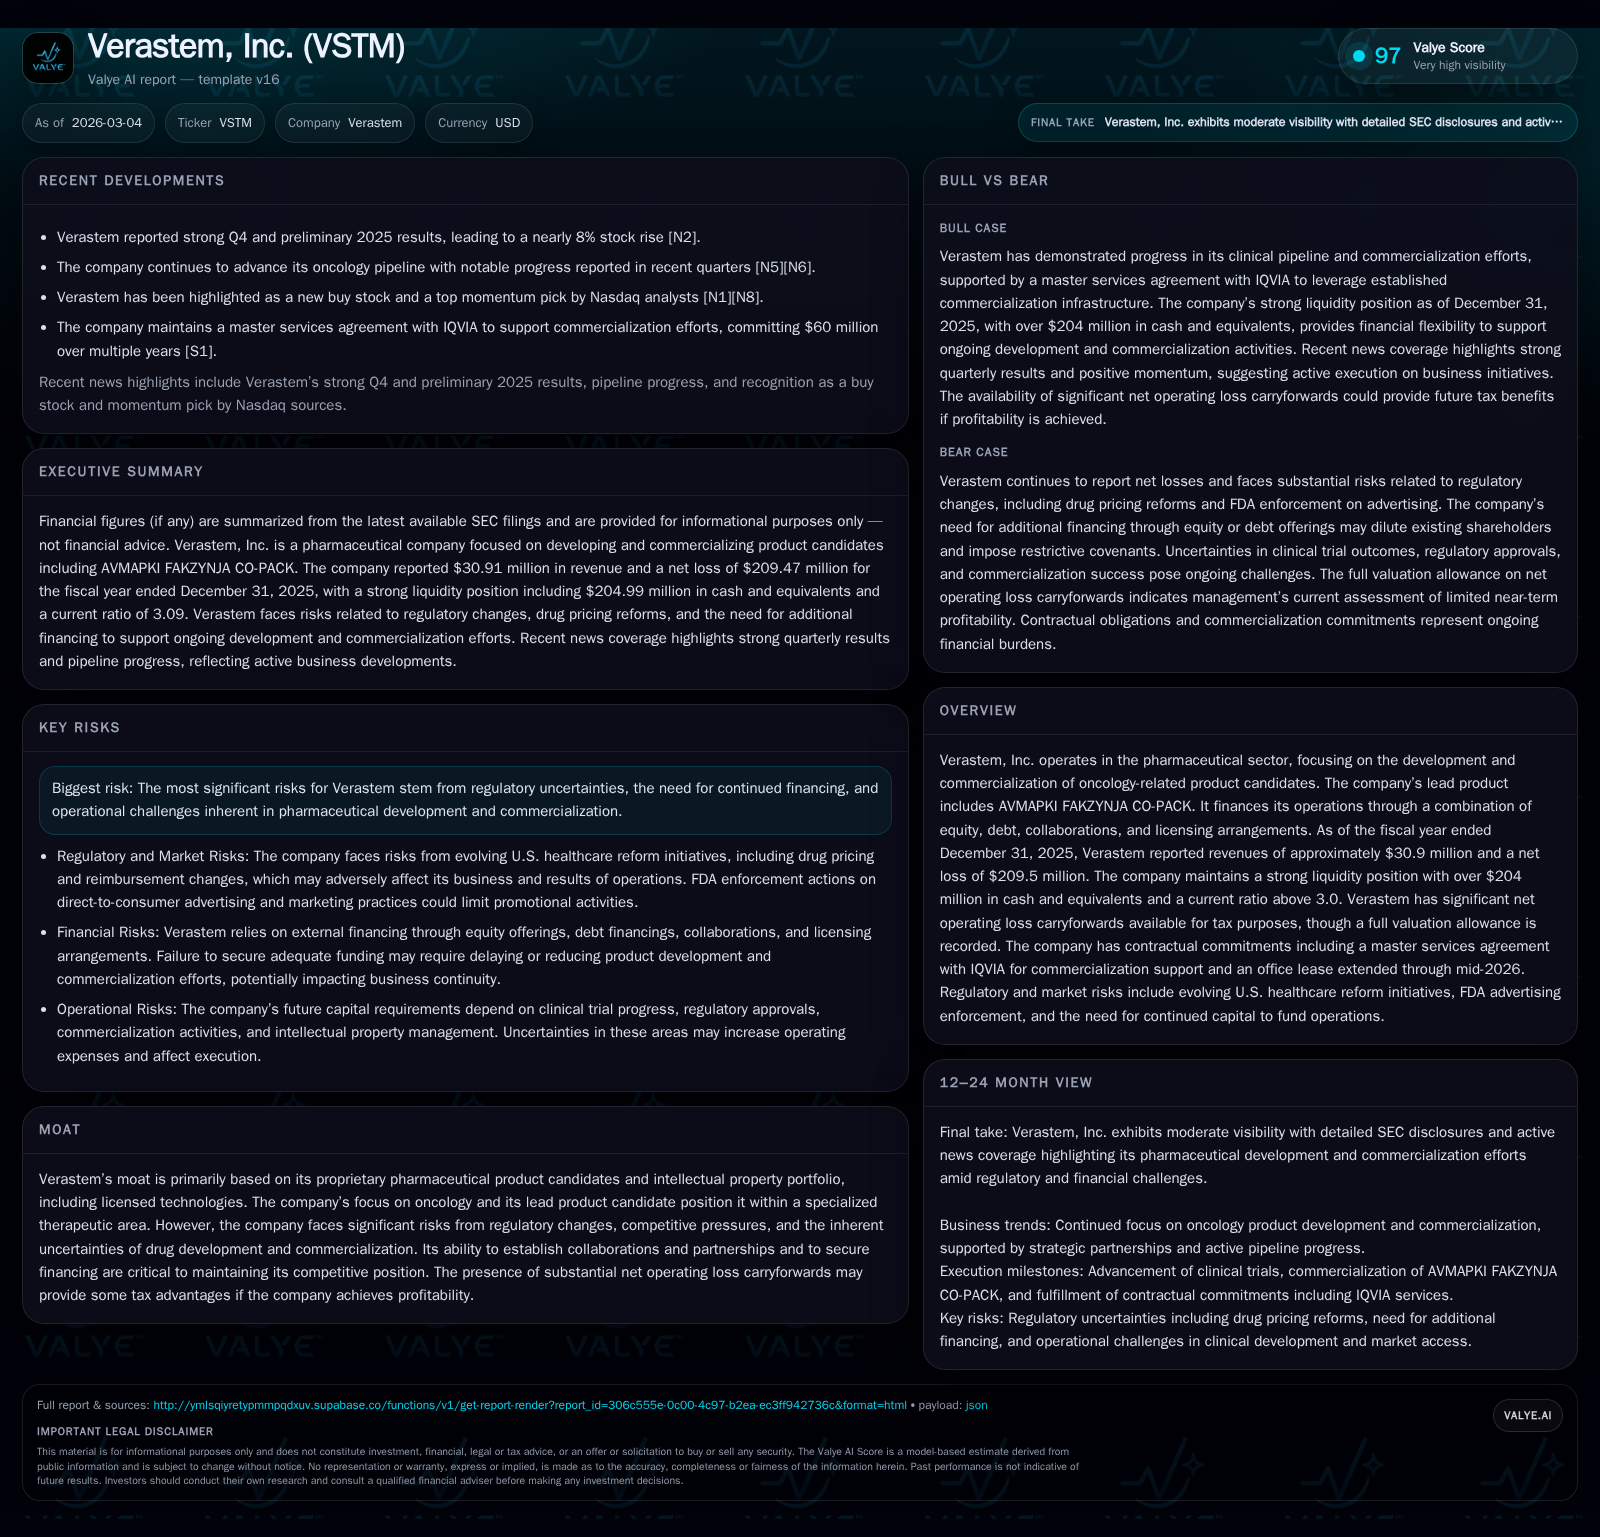
In 2025, Verastem achieved a remarkable revenue increase exceeding 200%, driven principally by commercialization of its lead oncology product AVMAPKI FAKZYNJA CO-PACK. Nonetheless, this top-line growth contrasted sharply with growing operating and net losses, which intensified due to simultaneous R&D expansion and commercialization expenditures. The company ended the year with robust liquidity—over $204 million in cash—and a strong current ratio above 3.0, supported by recent equity raises and a master services agreement with IQVIA for commercialization support. Regulatory headwinds including evolving drug pricing reforms and FDA advertising scrutiny pose ongoing risks. Monitoring near-term clinical milestones along with market uptake will be critical to assess its path toward profitability and sustainable cash flow generation.
Significant Revenue Expansion and Historical Financial Trends
Verastem’s financial trajectory through fiscal year 2025 reveals a striking ramp in revenues that contrasts with persistent operating losses common in emerging oncology biotechs. The company grew revenue from approximately $2.6 million in 2023 to $10 million in 2024, then accelerated sharply to $30.9 million in 2025—a compound annual growth rate exceeding 200% year-over-year most recently [F1]. This roughly threefold revenue surge reflects initial commercial sales traction primarily attributed to the lead product AVMAPKI FAKZYNJA CO-PACK following its introduction into the oncology market.
However, despite this revenue momentum, operating results remain deeply negative. Operating income deteriorated from -$72.9 million in 2022 to -$114.96 million in 2024 before expanding further to -$170.13 million in 2025 [F1]. Correspondingly, net income followed suit with widening losses reaching -$209.47 million last year [F1]. This illustrates the scale of upfront investment burdens Verastem faces during the early commercial phase: heavy R&D push coupled with substantial marketing and sales infrastructure costs that precede profit realization.
Historical performance (annual)
| FY | Rev ($mm) | Net ($mm) | CFO ($mm) | OpInc ($mm) | Rev YoY | Net YoY |
|---|---|---|---|---|---|---|
| 2025 | 31 | -209 | -138 | -170 | +209.1% | -60.3% |
| 2024 | 10 | -131 | -105 | -115 | +285.2% | -49.5% |
| 2023 | 3 | -87 | -86 | -92 | -18.4% | |
| 2022 | -74 | -64 | -73 |
Source: SEC companyfacts cache [F1].
Capital returns and efficiency (annual)
| FY | FCF ($mm) | ROE% |
|---|---|---|
| 2025 | -138 | -366.2 |
| 2024 | -105 | 452.1 |
| 2023 | -87 | -152.3 |
| 2022 | -64 | -155.8 |
Source: SEC companyfacts cache [F1].
Note: Capex consistent at low levels reflecting limited fixed asset investment.
Unpacking Cost Structure and Operating Loss Dynamics
The amplified operating deficit amid revenue gains spotlights Verastem’s expanded cost base aligned with typical oncology biopharma stages where meaningful upfront capital outlays are necessary before scaling profits.
Research and development expenditures remain elevated due to ongoing clinical trials essential for label expansions and pipeline advancement of current candidates like AVMAPKI FAKZYNJA CO-PACK. Concurrently, commercialization expenses have ballooned post-approval commensurate with establishing brand presence through direct-to-consumer campaigns and provider engagement—a costly but crucial step for penetration into oncology treatment regimens.
Moreover, operating losses highlight the hurdle of achieving operational leverage; incremental sales alone have not yet generated margin uplift sufficient to offset fixed-plus-variable costs largely locked into contracts such as the $60 million master services agreement with IQVIA for commercialization support spanning over multiple years [S9]. Without milestone accession from other product candidates or licensing income streams filling gaps, these sizable recurring expenses sustain negative earnings pressures for now.
Oncology Portfolio Focus and Product Commercialization Status
Verastem zeroes in on oncology therapeutics with an emphasis on its proprietary product AVMAPKI FAKZYNJA CO-PACK as the flagship offering currently driving top-line gains . This specialized niche provides some moat protection derived from intellectual property arrangements underpinning development assets alongside licensing agreements securing exclusive rights.
The company strategically partners for commercialization infrastructure—most notably the IQVIA alliance facilitating sales force deployment and distribution efficiency—reflecting industry norms where emerging biotechs rely on external Contract Research Organizations (CROs) or Contract Commercial Organizations (CCOs) for scalable market entry support without full internal buildup early stage [S9][N1]. Pipeline diversification beyond AVMAPKI remains limited publicly but is critical long term.
Regulatory Environment and Pricing Pressures Impacting Growth Trajectory
Shifting regulatory landscapes add complexity atop commercial execution challenges for Verastem’s oncology focus. Various recent U.S federal health policy reforms target prescription drug pricing reductions via Medicare negotiations under the Inflation Reduction Act of 2022 plus initiatives emphasizing accelerated generic/biosimilar competition, expanded over-the-counter switches, and drug importation facilitation [S2][S6].
Furthermore, directives for "most-favored nation" pricing approaches seek global parity benchmarks potentially curtailing pharmaceutical pricing power nationally [S2]. The FDA's intensified scrutiny of direct-to-consumer advertising—including issuance of warning letters for alleged deceptiveness—foreshadows tighter restrictions that could impact Verastem’s promotional campaigns supporting AVMAPKI adoption [S7][S13].
Material uncertainties linger about how these regulatory reforms will concretely affect reimbursement models or require strategic pivots in marketing tactics going forward.
Capital Structure, Liquidity Profile, and Financing Options
Verastem concluded FY2025 sitting on a robust liquidity cushion: approximately $205 million in cash and equivalents paired with over $223 million current assets versus around $72 million current liabilities yields a strong current ratio of about 3.09—denoting solid short-term financial health to fund operations beyond one year without immediate refinancing needs [F1][S4][S9].
Backing this position was a significant public equity offering finalized late-2025 that raised near $97 million net proceeds inclusive of exercised Greenshoe options providing necessary capital replenishment amid ongoing operational cash burn (-$137.5 million CFO for FY2025) [F1][S23][S25].
Debt exposure includes a floating-rate note purchase agreement totaling $75 million subject to SOFR-linked interest floors reducing sensitivity to short-term rate volatility somewhat [S4][S8]. However, covenants within debt agreements impose restrictions on incremental indebtedness or distributions restraining financial flexibility if operating performance deteriorates further.
Looking ahead, financing strategies combine equity raises plus selective licensing deals intended to mitigate dilution but risk contractual obligations relinquishing future revenue rights necessitate careful term negotiation balances [S1][S12].
Future Milestones to Monitor: Clinical Progress and Market Penetration
While explicit management forecasts remain undisclosed publicly, upcoming fundamental value inflections depend heavily on achieving regulatory milestones linked to AVMAPKI FAKZYNJA CO-PACK indications expansion or approval of additional candidates within Verastem’s pipeline [N1][N2][S1].
Moreover, tracking commercial uptake signals such as prescription volumes, formulary inclusions within managed care networks, payer reimbursements updates, as well as real-world evidence generation efficacy will be instrumental gauges of sustained growth potential.
Market observers should also watch collaboration progression details —including success attaining milestones or royalty thresholds under existing licensing frameworks—that materially impact cash flow timelines.
Dividend Policy, Capital Allocation, and Investor Returns Outlook
Given persistent net losses translating into approximate return on equity of negative 366% (calculated from net loss over shareholder equity) paired with significant negative free cash flow (-$137 million), Verastem maintains an allocation approach prioritizing reinvestment over distributions or capital return programs [F1].
Capital expenditure levels remain minimal supporting overhead infrastructure while emphasizing funnel development costs sustaining pipeline maturation pathways rather than asset-heavy expansion.
No dividends nor stock repurchase programs have been reported during recent periods consistent with sector norms for clinical-stage biotech entities still maneuvering commercialization inflection points.
Overall capital discipline appears focused principally on extending runway through strategic financing initiatives coupled with disciplined expense management while navigating pivotal growth stage investments confronting technical success uncertainties inherent to oncology drug development.
This analysis synthesizes SEC filings including Forms 10-K, 10-Q, associated Current Reports (8-K), alongside recent press disclosures without extending speculative forecasts ungrounded by available evidence sets.[F1][N1][N2][S1–S29] Readers should regard biotech-sector specifics such as regulatory fluxes alongside inherent clinical progress risks when considering Verastem’s operational dynamics.
Disclaimer: This is research-only, informational analysis and not investment advice. It may include AI-generated interpretation and general industry context. Always verify important details using primary sources.
Comments