
Werner Enterprises Faces Profitability Strains Despite Stable Revenue and Strategic Acquisition
2025 saw Werner Enterprises post near $3 billion in revenue but a net loss, highlighting pressures amid strategic expansion.
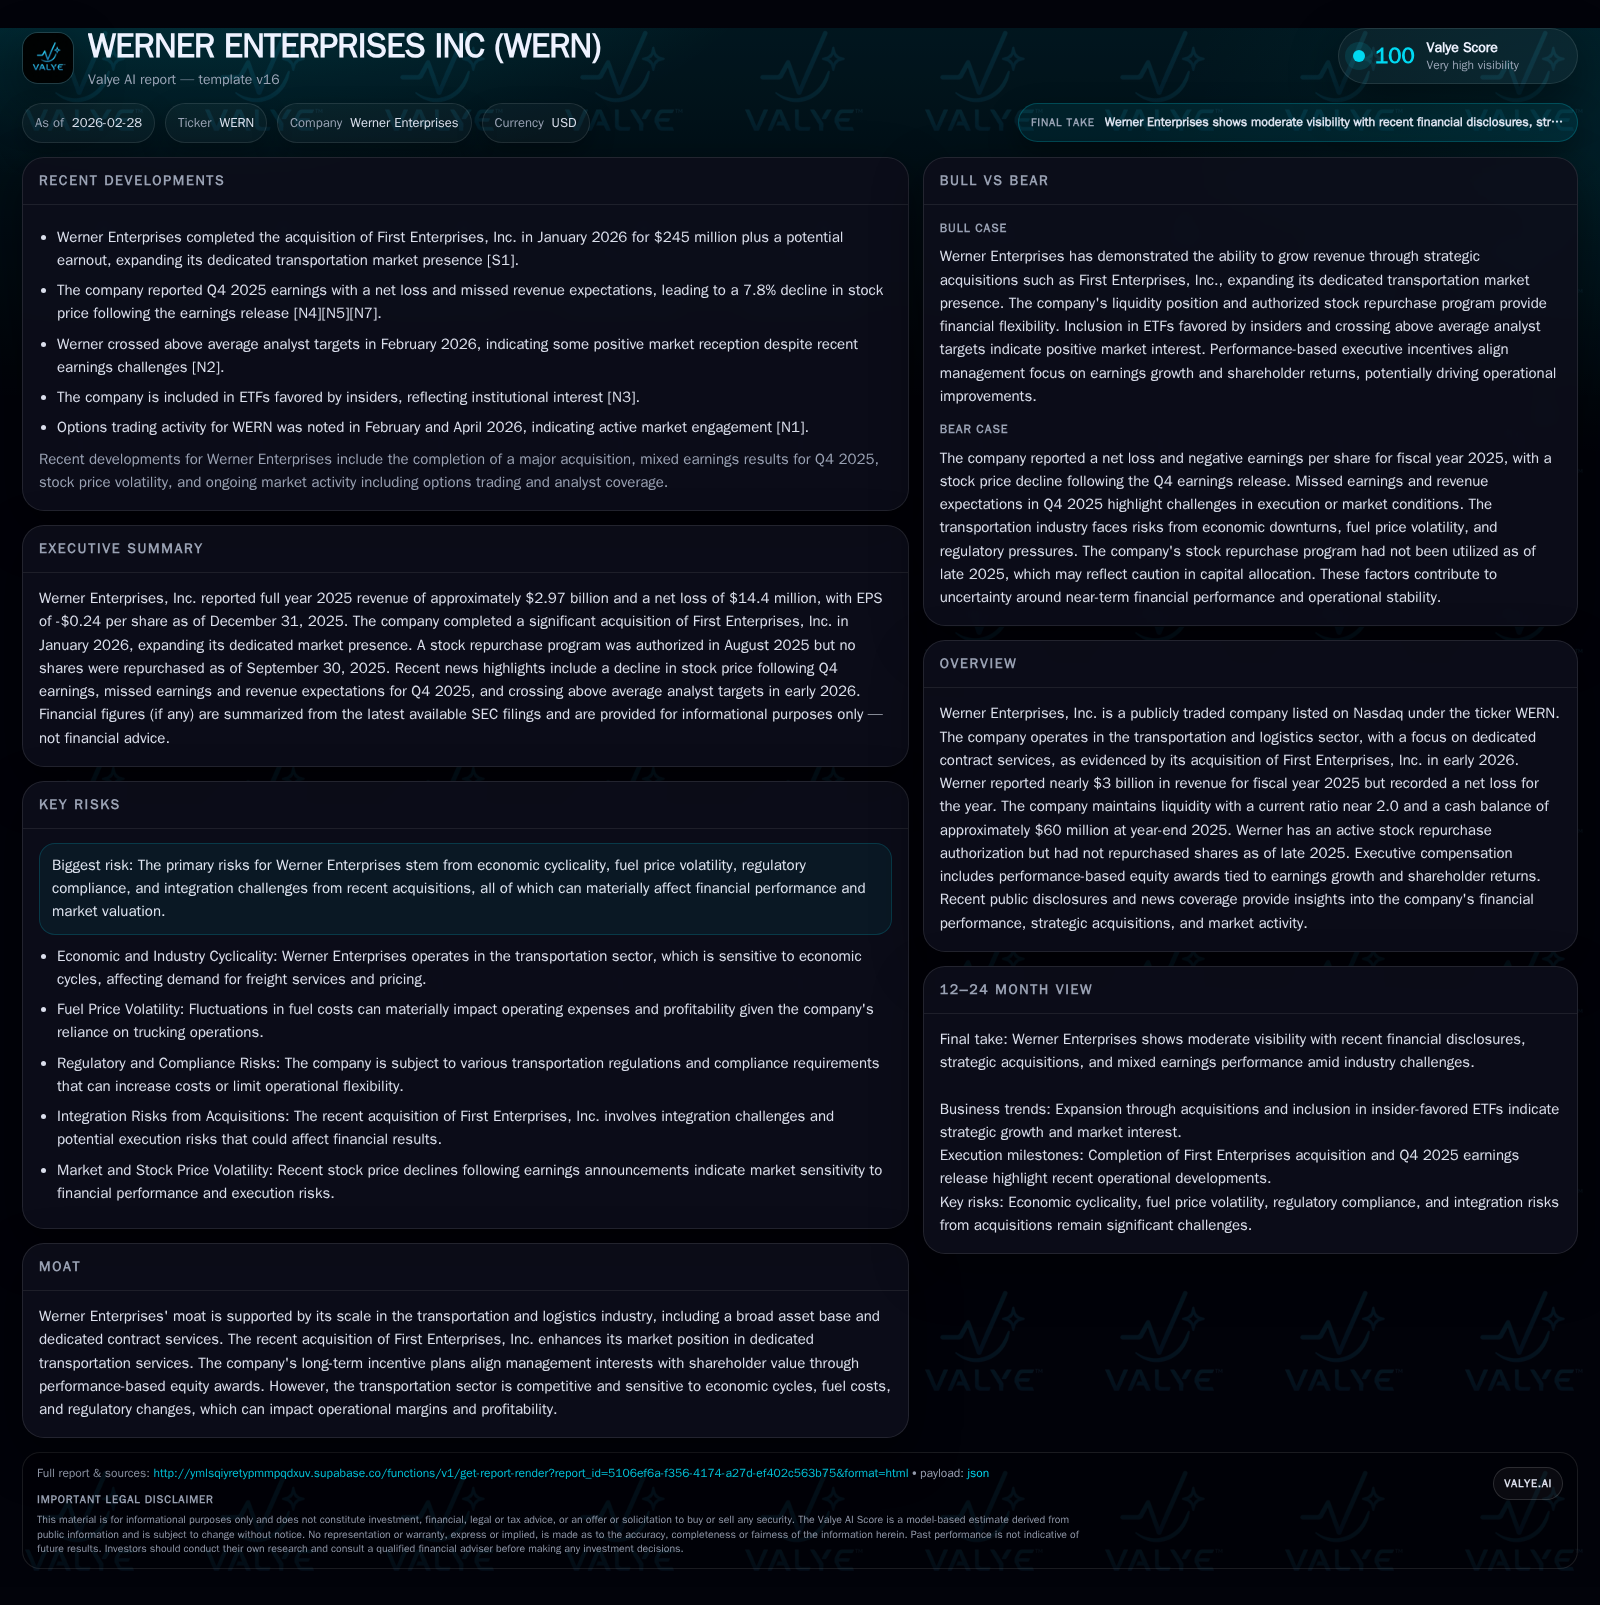
Werner Enterprises reported nearly $3 billion in revenue for fiscal year 2025, a modest decline compared to prior years, alongside a significant drop in profitability leading to a net loss of $14.4 million. The company strengthened its dedicated contract services through the acquisition of First Enterprises, Inc. in early 2026, aiming to bolster market presence. However, deteriorating operating income and negative free cash flow underscore persistent margin and integration challenges within the competitive transportation sector. Capital allocation remains balanced between dividends and cautious stock repurchases, while management compensation aligns with performance metrics tied to earnings growth.
Historical Performance Trends
Werner Enterprises maintained substantial scale with revenue near $3 billion in fiscal year 2025, down slightly by 1.8% from the prior year’s $3.03 billion [F1]. This stability masks significant operational challenges reflected in profitability metrics.
Operating income fell sharply by 82.4% year-over-year to approximately $11.7 million in 2025 from $66.1 million in 2024 [F1]. The decline highlights margin compression likely driven by increased costs and competitive pressures within the trucking sector.
Net income swung into negative territory with a loss of $14.4 million for 2025 compared to positive earnings in previous years (e.g., $34.2 million in 2024) [F1]. This reversal suggests additional financial strains including possible one-time charges or integration costs.
Cash flow from operations also declined significantly by nearly 45% year-over-year to about $182 million [F1]. Capital expenditures remained elevated at over $250 million despite a reduction from prior years’ peaks, resulting in negative free cash flow of roughly $68.5 million [F1]. This indicates ongoing investment commitments that have yet to generate positive cash returns.
Liquidity remains sound with a current ratio close to 2.0 supported by approximately $60 million in cash and equivalents at year-end [F1], reflecting prudent balance sheet management amid volatility.
Historical performance (annual)
| FY | Rev ($bn) | Net ($mm) | CFO ($mm) | OpInc ($mm) | Rev YoY | Net YoY |
|---|---|---|---|---|---|---|
| 2025 | 3.0 | -14 | 182 | 12 | -1.8% | -142.1% |
| 2024 | 3.0 | 34 | 330 | 66 | -7.7% | -69.5% |
| 2023 | 3.3 | 112 | 474 | 176 | -0.2% | -53.4% |
| 2022 | 3.3 | 241 | 449 | 323 |
Source: SEC companyfacts cache [F1].
Capital returns and efficiency (annual)
| FY | Div ($mm) | Buybacks ($mm) | FCF ($mm) |
|---|---|---|---|
| 2025 | 34 | 56 | -69 |
| 2024 | 35 | 67 | -84 |
| 2023 | 34 | 0 | -124 |
| 2022 | 32 | 110 | -59 |
Source: SEC companyfacts cache [F1].
Table: Key financial metrics for Werner Enterprises FY2022–FY2025 [F1]
Strategic Growth Initiatives
In January 2026, Werner completed the acquisition of First Enterprises, Inc., a dedicated contract services provider, for approximately $245 million plus an earnout component based on gross revenues and an additional real estate purchase valued near $38 million [S22]. This acquisition aims to expand Werner’s footprint in higher-margin dedicated logistics services, which offer more predictable revenue streams relative to spot market freight.
The move reflects Werner’s strategic focus on enhancing specialized service offerings amid industry headwinds [N6][S22]. While this could improve utilization and operational efficiency over time, integration risks remain notable given the complexities inherent in mergers within transportation sectors [S4][S18].
Outlook and Operational Considerations
Werner has not provided explicit forward guidance but investor attention is centered on:
- Realization of synergies from the First Enterprises acquisition,
- Management of fuel surcharge recoveries embedded within revenues,
- Capital expenditure pacing aligned with fleet modernization,
- Execution on route optimization technologies aimed at improving operating leverage,
- Achievement of executive compensation targets linked to three-year diluted EPS growth and total shareholder return modifiers [S10][S16].
Results during calendar year 2026 will be pivotal in assessing whether Werner can restore profitability and margin stability.
Returns and Capital Allocation
The company maintains disciplined capital allocation with steady dividend payments around $34 million annually despite profitability challenges [F1][S8]. A new share repurchase program authorizing up to five million shares was approved in August 2025; however, no shares were repurchased through Q3 of that year according to filings [S8]. Annual data shows approximately $55.6 million spent on buybacks during full FY2025 period [F1], indicating some repurchase activity post-Q3.
Executive compensation incorporates performance-based restricted stock units vesting over three years and performance stock units contingent on multi-year EPS growth plus TSR relative to peers [S10][S16]. This structure aligns management incentives with shareholder value creation.
Industry Context and Risks
Werner operates within a capital-intensive trucking industry characterized by thin margins sensitive to fuel price volatility, labor market dynamics, regulatory compliance costs, and macroeconomic cycles [S4][S18]. Dedicated contract services provide relatively stable demand but require scale efficiencies and effective integration capabilities.
Technological investments such as telematics and route optimization are increasingly critical but contribute short-term cost pressures affecting free cash flow profiles.
Conclusion
Werner Enterprises’ fiscal results for 2025 illustrate significant profitability pressures despite stable revenues near $3 billion. The strategic acquisition of First Enterprises signals intent to bolster dedicated contract services—potentially enhancing revenue stability if integration proceeds smoothly.
Robust liquidity metrics provide some cushion against operational challenges; however, sustained margin recovery hinges on successful execution of strategic initiatives alongside disciplined capital management.
Investors should monitor forthcoming quarterly results for signs of margin improvement and successful integration progress.
This analysis is based solely on publicly available company filings including Forms 10-K/10-Q/8-K as well as reputable news sources cited herein without speculative forecasts or investment recommendations.
Disclaimer: This is research-only, informational analysis and not investment advice. It may include AI-generated interpretation and general industry context. Always verify important details using primary sources.
Comments