
Western New England Bancorp’s Earnings Surge Reflects Renewed Regional Lending Strength
A 58.4% net income increase in FY2025 underscores the bank’s strong lending franchise and prudent capital management in Massachusetts.
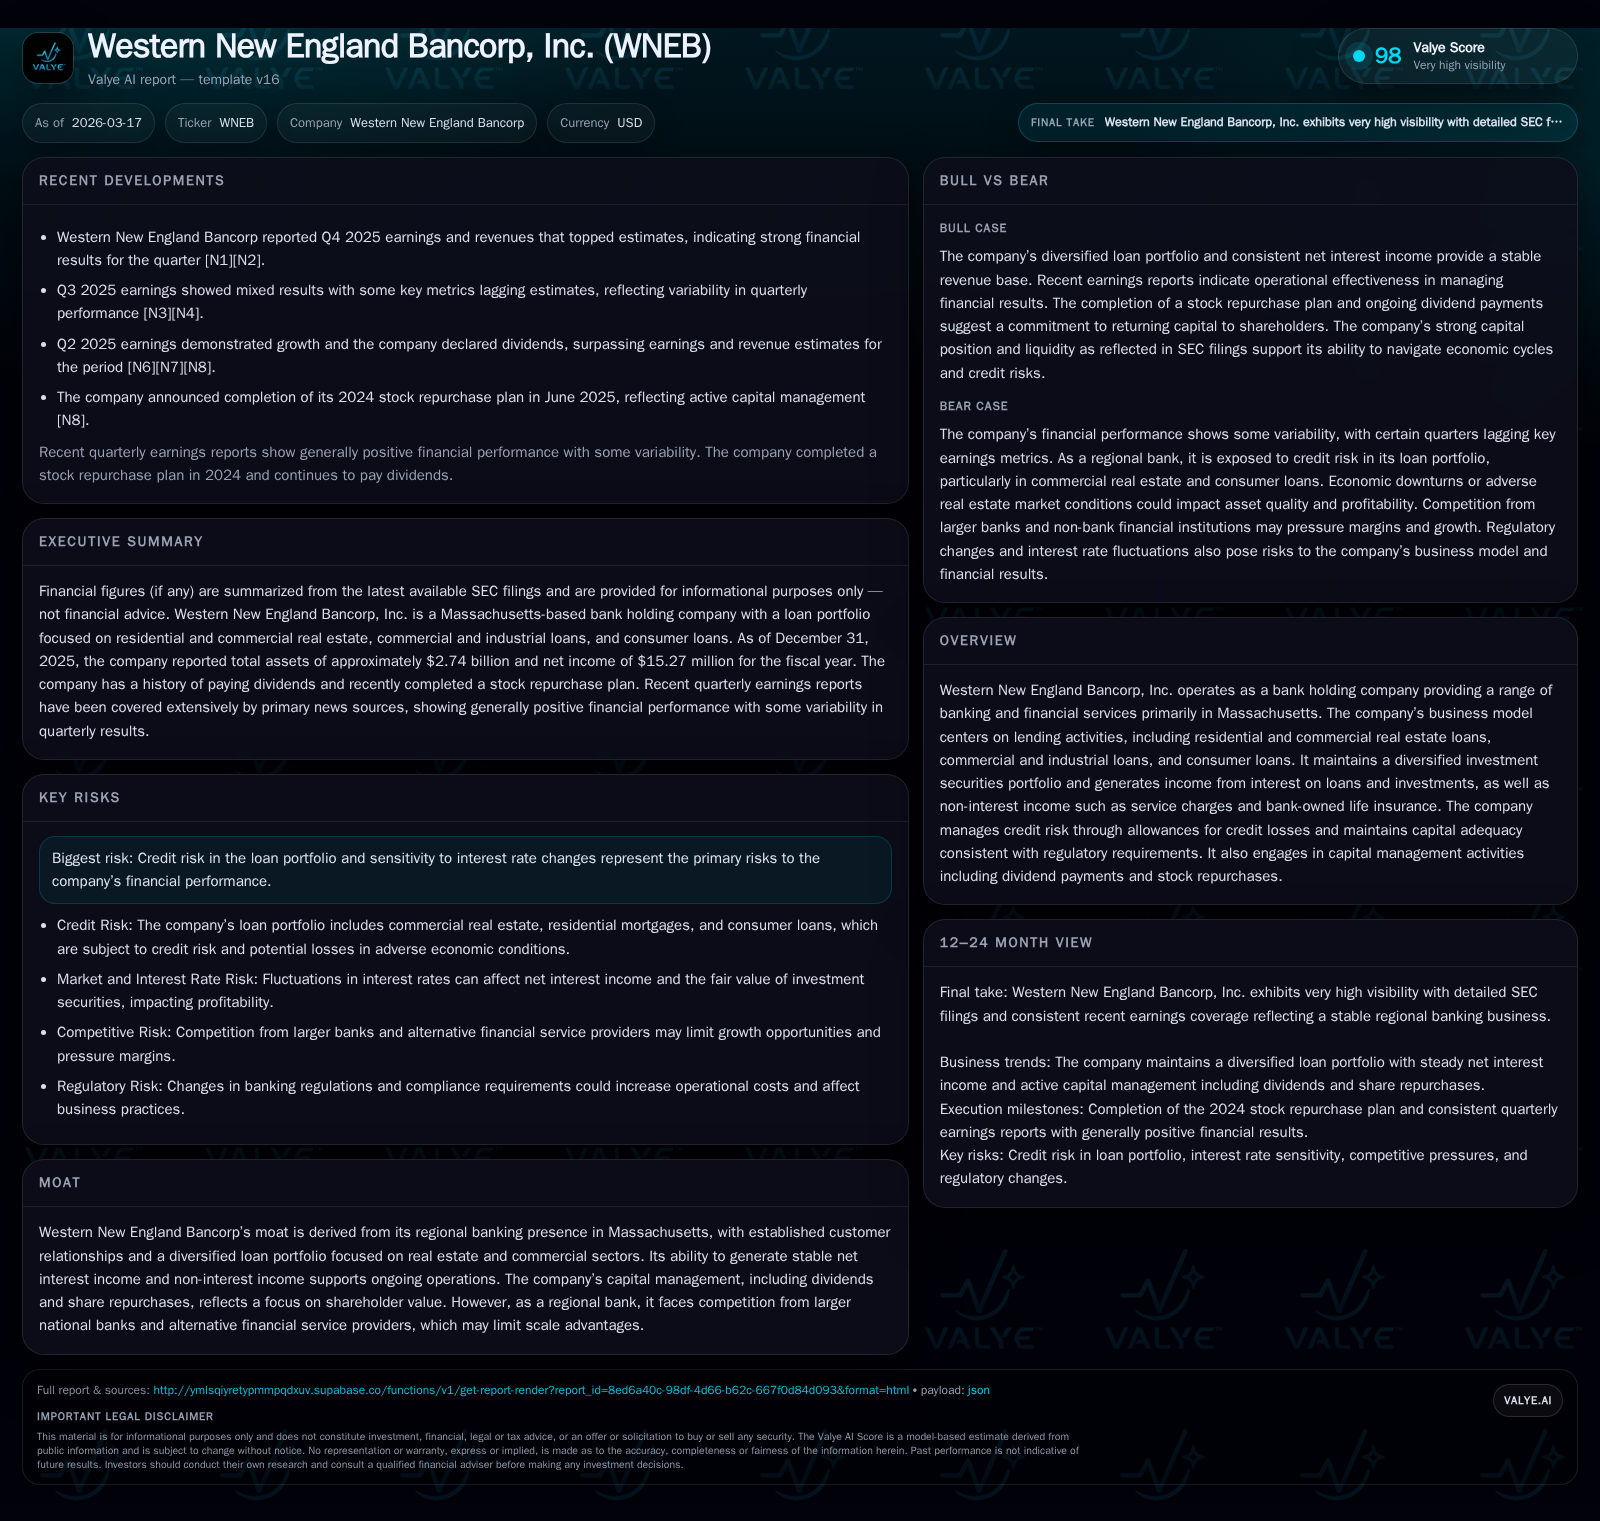
Western New England Bancorp, Inc. (WNEB) reported a solid rebound in net income to $5.21 million in fiscal 2025, up 58.4% from $3.29 million in 2024, driven primarily by core lending activities within its Massachusetts regional footprint. Operating cash flow expanded nearly 50%, reflective of improved cash-generative efficiency. The bank's loan portfolio remains well diversified across residential and commercial real estate, commercial and industrial, and consumer loans, with disciplined credit risk management supported by stable allowances for credit losses. Capital structure exhibits steady equity growth and conservative liquidity while capital allocation balances shareholder returns with buybacks and dividends amid competitive pressures. Forward growth outlook suggests moderate expansion constrained by scale relative to national peers, with key metrics such as credit quality and capital deployment to watch closely.
Strong Earnings Recovery Driven by Core Lending Activities
Western New England Bancorp, Inc. posted a marked net income increase to $5.21 million for fiscal year 2025, a substantial gain of 58.4% over the prior year’s $3.29 million figure [F1]. This earnings resurgence is anchored chiefly in the company’s core lending operations entrenched within Massachusetts’ regional banking environment.
The improvement reflects stability in the net interest margin (NIM), a crucial metric for regional lenders where asset repricing capabilities are often limited compared to larger institutions. While exact NIM figures are not separately disclosed here, the notable rise in operating cash flow further confirms improved yield capture and cost controls [F1]. Non-interest income streams including service charges and bank-owned life insurance proceeds contributed complementary revenue stability supporting operating profits.
This rebound contrasts with more volatile earnings performance seen over recent years—highlighting an operational inflection point where lending demand has improved or credit conditions moderated, lifting overall profitability.
Loan Portfolio Composition and Credit Risk Management
WNEB’s lending book demonstrates solid diversification spanning residential mortgages, commercial real estate (comprising both owner-occupied and non-owner occupied segments), commercial & industrial (C&I) loans, and consumer credit lines [S4][S6]. The bulk of loan assets remain concentrated within Massachusetts, reinforcing a strategic focus on deepened regional relationships.
Credit risk management is evidenced by consistent maintenance of allowances for credit losses that keep pace with portfolio quality trends without outsized provisions suggesting asset stress [F1][S6]. Delinquency data points reveal that financial assets past due over 30 days remain controlled across all loan categories with non-performing financing receivables minimal at fiscal year-end 2025 [S16]. Such discipline indicates a cautious underwriting posture offsetting systemic risks associated with cyclical changes or localized economic disruptions.
Notably, the company’s exposure to interest rate sensitivity is mitigated via diversified asset classes—residential real estate loans typically provide fixed-rate cash flow stability whereas C&I loans lend some repricing flexibility.
Capital Structure and Liquidity: Stability in a Competitive Market
Capital adequacy remains robust with shareholders’ equity increasing from roughly $235.9 million at December 31, 2024 to $247.6 million at end-2025 reflecting retained earnings growth adjusted for payouts [F1][S4][S5]. This effective capitalization exceeds baseline regulatory requirements which is a key buffer against cyclical loan risks.
On the liability side, WNEB relies predominantly on deposits that grew moderately within the year—a desirable trend favoring stable core funding sources over wholesale borrowings which stood near approximately $106 million at year-end [S4][S5]. This funding mix preserves liquidity buffers critical to navigating competitive pressures from national banks aggressively targeting market share.
Short-term borrowings ticked higher but remain small relative to total liabilities enhancing structural stability.
Capital Allocation Priorities: Balancing Dividends and Buybacks
Western New England Bancorp continues its disciplined capital distribution strategy paying dividends totaling $5.71 million in fiscal 2025 — slightly down from $5.91 million in prior year but sustained within a consistent range over several years [F1][S14]. Simultaneously, share repurchases amounted to approximately $6.10 million during the same period, reflecting active management of equity base notwithstanding an environment of modest returns.
Return on equity stands near 2.1%, indicative of the challenges faced by regional banks competing on scale amid tight margins [F1]. However, free cash flow generated—calculated as operating cash flow ($18.21 million) minus capital expenditures ($1.07 million)—remains substantial at approximately $17.14 million underpinning ongoing shareholder distributions without excessive leverage or external financing dependence.
Examining Forward Growth Outlook and Industry Challenges
Looking ahead, Western New England Bancorp operates within an industry characterized by increasing consolidation among regional players alongside intensifying competition from national banks endowed with scaling advantages as well as digital-first alternative lenders [S2]. Growth is expected to be moderate given these constraints paired with prudential risk management practices designed to preserve credit quality amidst interest rate volatility inherent to their loan portfolio composition.
Maintaining competitive advantage hinges largely on leveraging entrenched local relationships combined with product diversification across residential lending and commercial sectors specific to Massachusetts markets—a niche demanding nuanced understanding where broader competitors may lack granularity.
Key Performance Metrics and What to Monitor Next
The following table synthesizes key financial performance indicators for FY2022 through FY2025:
Historical performance (annual)
| FY | Net ($mm) | CFO ($mm) | Capex ($mm) | Net YoY |
|---|---|---|---|---|
| 2025 | 5 | 18 | 1 | +58.4% |
| 2024 | 3 | 12 | 1 | +30.9% |
| 2023 | 3 | 15 | 3 | -72.2% |
| 2022 | 9 | 36 | 1 |
Source: SEC companyfacts cache [F1].
Capital returns and efficiency (annual)
| FY | Div ($mm) | Buybacks ($mm) | FCF ($mm) |
|---|---|---|---|
| 2025 | 6 | 6 | 17 |
| 2024 | 6 | 8 | 11 |
| 2023 | 6 | 5 | 12 |
| 2022 | 5 | 6 | 35 |
Source: SEC companyfacts cache [F1].
Recent events such as the announced retirement of a longstanding board director may signal governance transitions influencing strategic priorities at upcoming annual meetings [S3]. Continued vigilance around evolving loan credit metrics—especially substandard or criticized exposures—and potential shifts in capital deployment strategies will be instructive for assessing future financial trajectory.
Disclaimer: This analysis is based solely on information available as of March 17, 2026, including SEC filings and company disclosures without provision of investment advice or recommendations.
Disclaimer: This is research-only, informational analysis and not investment advice. It may include AI-generated interpretation and general industry context. Always verify important details using primary sources.
Comments