
Mechanics Bancorp Returns to Profitability with Merger Integration Challenges Ahead
After years of losses, Mechanics Bancorp achieved a notable profitability rebound in 2025, yet faces complex post-merger integration and regulatory hurdles.
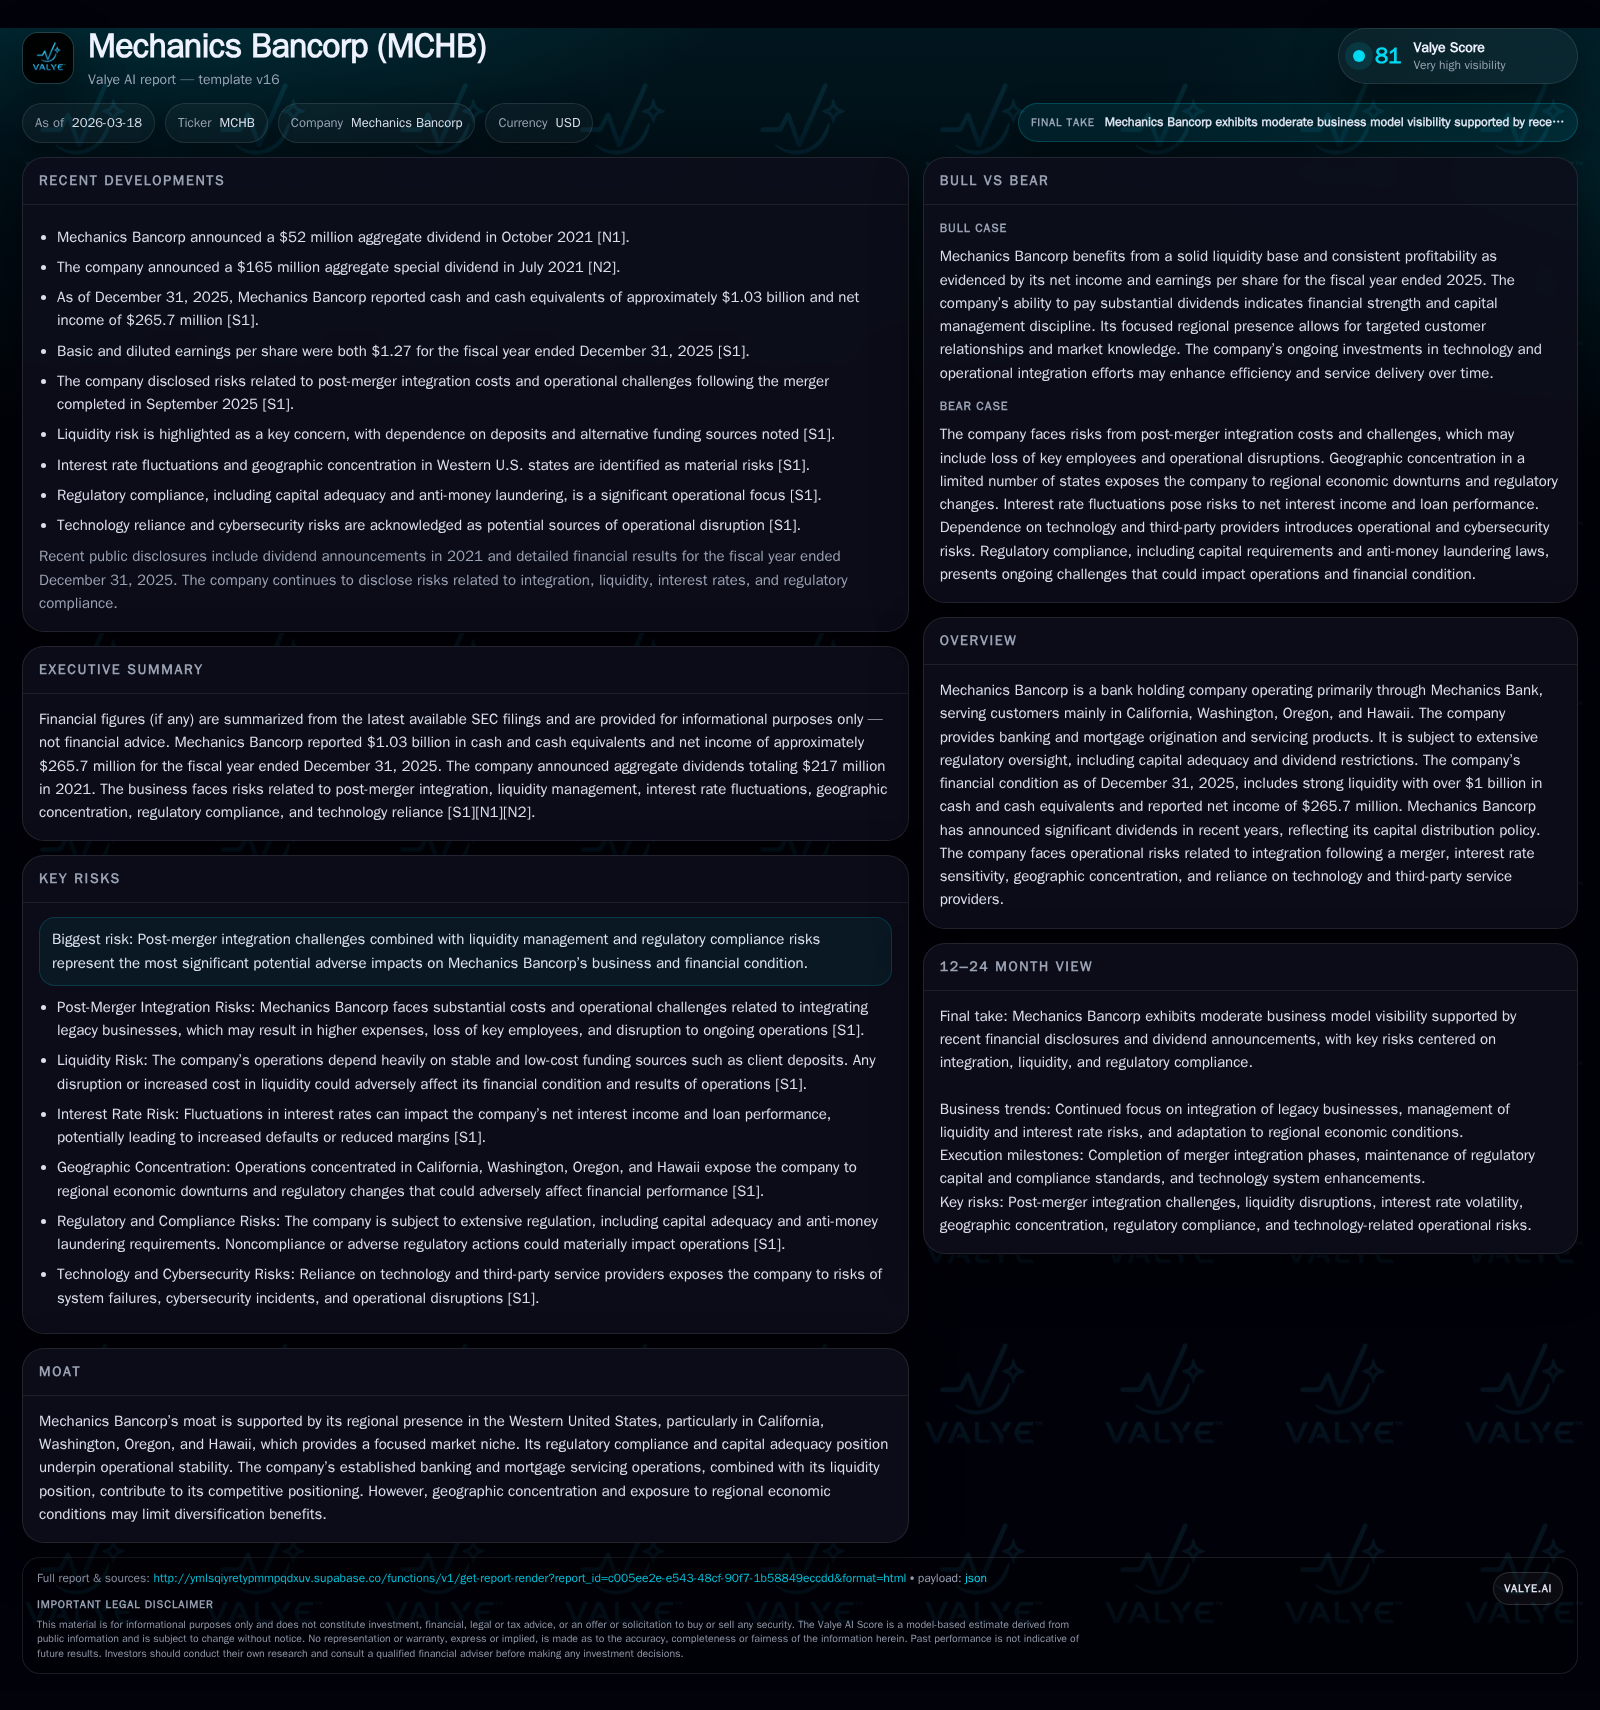
Mechanics Bancorp reversed a multi-year net loss trend to report $265.7 million in net income for fiscal 2025, buoyed by merger-related operational gains and restored cash flows. Despite this financial turnaround, the company continues to bear significant integration costs and operational risks stemming from the September 2025 merger, which cloud the realization of anticipated synergies. With a concentrated regional footprint in Western U.S. states and an ample liquidity buffer exceeding $1 billion, Mechanics Bancorp is positioned strategically yet must navigate regulatory capital constraints and market competition. Near-term growth will depend on successful integration execution, interest rate trends impacting mortgage services, and effective capital deployment under regulatory scrutiny.
Financial Turnaround Fueled by Merger-Driven Gains
Mechanics Bancorp marked a dramatic financial reversal in fiscal year 2025 following years of incremental challenges. After net losses of $27.5 million in 2023 and $144.3 million in 2024, the company reported net income of approximately $265.7 million by year-end 2025—a remarkable turnaround representing a 284.1% increase year-over-year [F1]. This swing coincided directly with the completion of its September 2025 merger with legacy HomeStreet Bank.
Operating cash flow (CFO) mirrored this recovery trend decisively. The company reported CFO of roughly $193.6 million for 2025 compared to a negative CFO of $45.9 million in the preceding year—a gain exceeding 520% [F1]. This indicates not simply accounting gains but improved underlying cash generation capacity absent reliance on balance sheet adjustments or one-time accounting entries.
Capital expenditure (capex) surged markedly in FY25 to roughly $6.5 million from just $490 thousand the year prior [F1], indicative of increased investment related to integrating merged operations. Such elevated capex aligns with typical merger phases where technology systems consolidation and physical branch network rationalizations demand upfront outlays.
Merger Integration Costs and Operational Complications
Despite strong headline profitability metrics, Mechanics Bancorp disclosed ongoing substantial expenses tied explicitly to post-merger integration efforts [S1]. These include legal and advisory fees, severance costs associated with employee restructuring, technology system consolidations across finance, treasury management and payroll platforms, as well as risk management function alignments.
The company also faces uncertainty regarding timing and magnitude of synergies due to complex integrations of legacy business lines spanning banking operations and mortgage servicing [S1]. Merger-related charges continue unpredictably as processes including pricing harmonization, vendor management consolidation and compliance policy unification evolve.
Potential retention costs for key personnel highlight risks that disruptions could detract from revenue streams if business relationships or institutional knowledge were impaired during transitions [S1]. Executing these integrations without productivity losses or customer attrition will be determinative for achieving forecasted efficiency gains.
Geographic Focus and Market Niches Underpinning Strategy
Mechanics Bancorp's moat is found largely in its concentrated footprint covering California, Washington, Oregon and Hawaii [S18]. This regional specialization offers advantages in customer relationship depth and market knowledge but conversely exposes the firm heavily to localized economic cycles.
For instance, housing market dynamics notably impact its mortgage origination volumes—higher interest rates dampening refinancing activities pose headwinds—and downturns within these states can disproportionately affect asset quality amidst limited geographic diversification [S18]. Such concentration mandates active monitoring of real estate valuations given their collateral importance for lending security [S8][S27].
Liquidity Profile and Capital Structure Amid Regulatory Oversight
At December 31, 2025, Mechanics Bancorp maintained strong liquidity evidenced by over $1 billion in cash and cash equivalents [F1]. This ample buffer supports both operating needs and compliance with liquidity requirements critical under bank regulatory regimes [S4][S5]. The bank relies predominantly on stable client deposits though utilizes brokered deposits sparingly due to constraints tied to maintaining "well-capitalized" status [S5].
Regulatory guidelines systematically govern the company's access to alternative funding sources such as Federal Home Loan Bank advances or federal funds lines when needed; however availability fluctuates with economic conditions affecting both demand for wholesale funding and Mechanics Bancorp’s perceived creditworthiness [S4][S22].
Capital adequacy requirements remain stringent; failure to meet minimum levels could restrict activities including dividend payments or share repurchases and might require raising additional capital under potentially dilutive terms [S13][S15][S19].
Dividend Policy Within Regulatory Boundaries
Dividend decisions hinge on statutory limits primarily based on retained earnings or net income at the bank subsidiary level along with supervisory oversight aimed at preventing unsafe capital distributions that might jeopardize ongoing operations [S6][S13].
Recent years have seen dividends constrained amid volatility induced by merger costs restricting consistent payout growth. The company balances returning capital against reinvesting internally to support integration expenses.
Forward-Looking Growth Drivers and Potential Constraints
Growth opportunities center on expanding mortgage origination volume underpinned by cross-selling into existing deposit customer bases across its West Coast markets [S18]. Additionally, scaling mortgage servicing capabilities promises fee income streams less sensitive to rate cycles once scale is achieved.
Nevertheless risks remain sizable including possible delays or cost overruns in synergy achievement from merger integration efforts [S1][S7]. Interest rate increases can reduce loan demand while competition from fintech firms intensifies pressure on traditional banking products especially digital offerings [S16].
Risks to Stability: Post-Merger Integration, Regulatory, and Market Pressures
Post-merger cost overruns or delays pose notable risks that could materially impact profitability or undermine anticipated revenue enhancements [S1]. Loan portfolio quality is vulnerable due to heavy real estate collateralization coupled with appraisals potentially overstating property values amid recent commercial office declines driven by hybrid work trends [S8][S18][S27]. Environmental liabilities stemming from foreclosed properties introduce additional contingent exposures requiring close management attention [S7].
Cybersecurity threats remain elevated given heavy reliance on information systems; breaches could cause reputational damage or regulatory penalties impacting customer trust [S17]. Increasingly complex regulations impose costly compliance burdens that may constrain margins further or limit business flexibility [S9][S14].
Capital Allocation Patterns Reflecting Strategic Priorities
Elevated FY25 capex spending near $6.5 million evidences prioritization of integrating legacy systems post-merger compared with previous low levels circa half a million dollars annually earlier in the transition period [F1]. Buyback activity remains dormant despite improved earnings while dividend distributions continue modestly reflecting cautious capital stewardship amid uncertain operating environment [F1].
Calculated return on equity for FY25 stands near 9.3%, improving markedly from prior loss years though still signaling room for enhancement as efficiency gains from merger synergies materialize fully [F1].
Key Performance Metrics and What To Monitor Next
Historical performance (annual)
| FY | Net ($mm) | CFO ($mm) | Capex ($mm) | Net YoY |
|---|---|---|---|---|
| 2025 | 266 | 194 | 7 | +284.1% |
| 2024 | -144 | -46 | 0 | -424.7% |
| 2023 | -28 | 8 | 4 | -141.3% |
| 2022 | 67 | 218 | 7 |
Source: SEC companyfacts cache [F1].
Capital returns and efficiency (annual)
| FY | Buybacks ($mm) | FCF ($mm) | ROE% |
|---|---|---|---|
| 2025 | 187 | 9.3 | |
| 2024 | -46 | -36.4 | |
| 2023 | 0 | 4 | -5.1 |
| 2022 | 75 | 212 | 11.8 |
Source: SEC companyfacts cache [F1].
Results underscore profitability restoration alongside robust operational cash inflows despite heightened integration-related spend.
Looking forward investors should monitor progress against projected merger synergies including reported cost savings measures alongside disclosures on ongoing integration charges [S1]. Dividend declarations relative to retained earnings thresholds deserve scrutiny as signals of confidence under regulatory oversight [S6][S13]. Liquidity position changes may indicate funding pressures especially if deposit competition intensifies or alternative funding becomes constrained [S4][S5]. Public commentary or rating agency assessments could alter perceptions around capital flexibility crucial for future growth or acquisitions.
This analysis synthesizes Securities & Exchange Commission filings dated March 17-18, 2026 ([S1]-[S29]), alongside financial statement data as presented ([F1]). It reflects current facts without speculative forecasts or investment recommendations.
Disclaimer: This is research-only, informational analysis and not investment advice. It may include AI-generated interpretation and general industry context. Always verify important details using primary sources.
Comments