
American Airlines Consolidates Fleet Risks and Navigates Pilot Shortages in Q2 Update
Q2 2026 results highlight capacity expansion tempered by supply chain and labor challenges shaping operational and financial outlook.
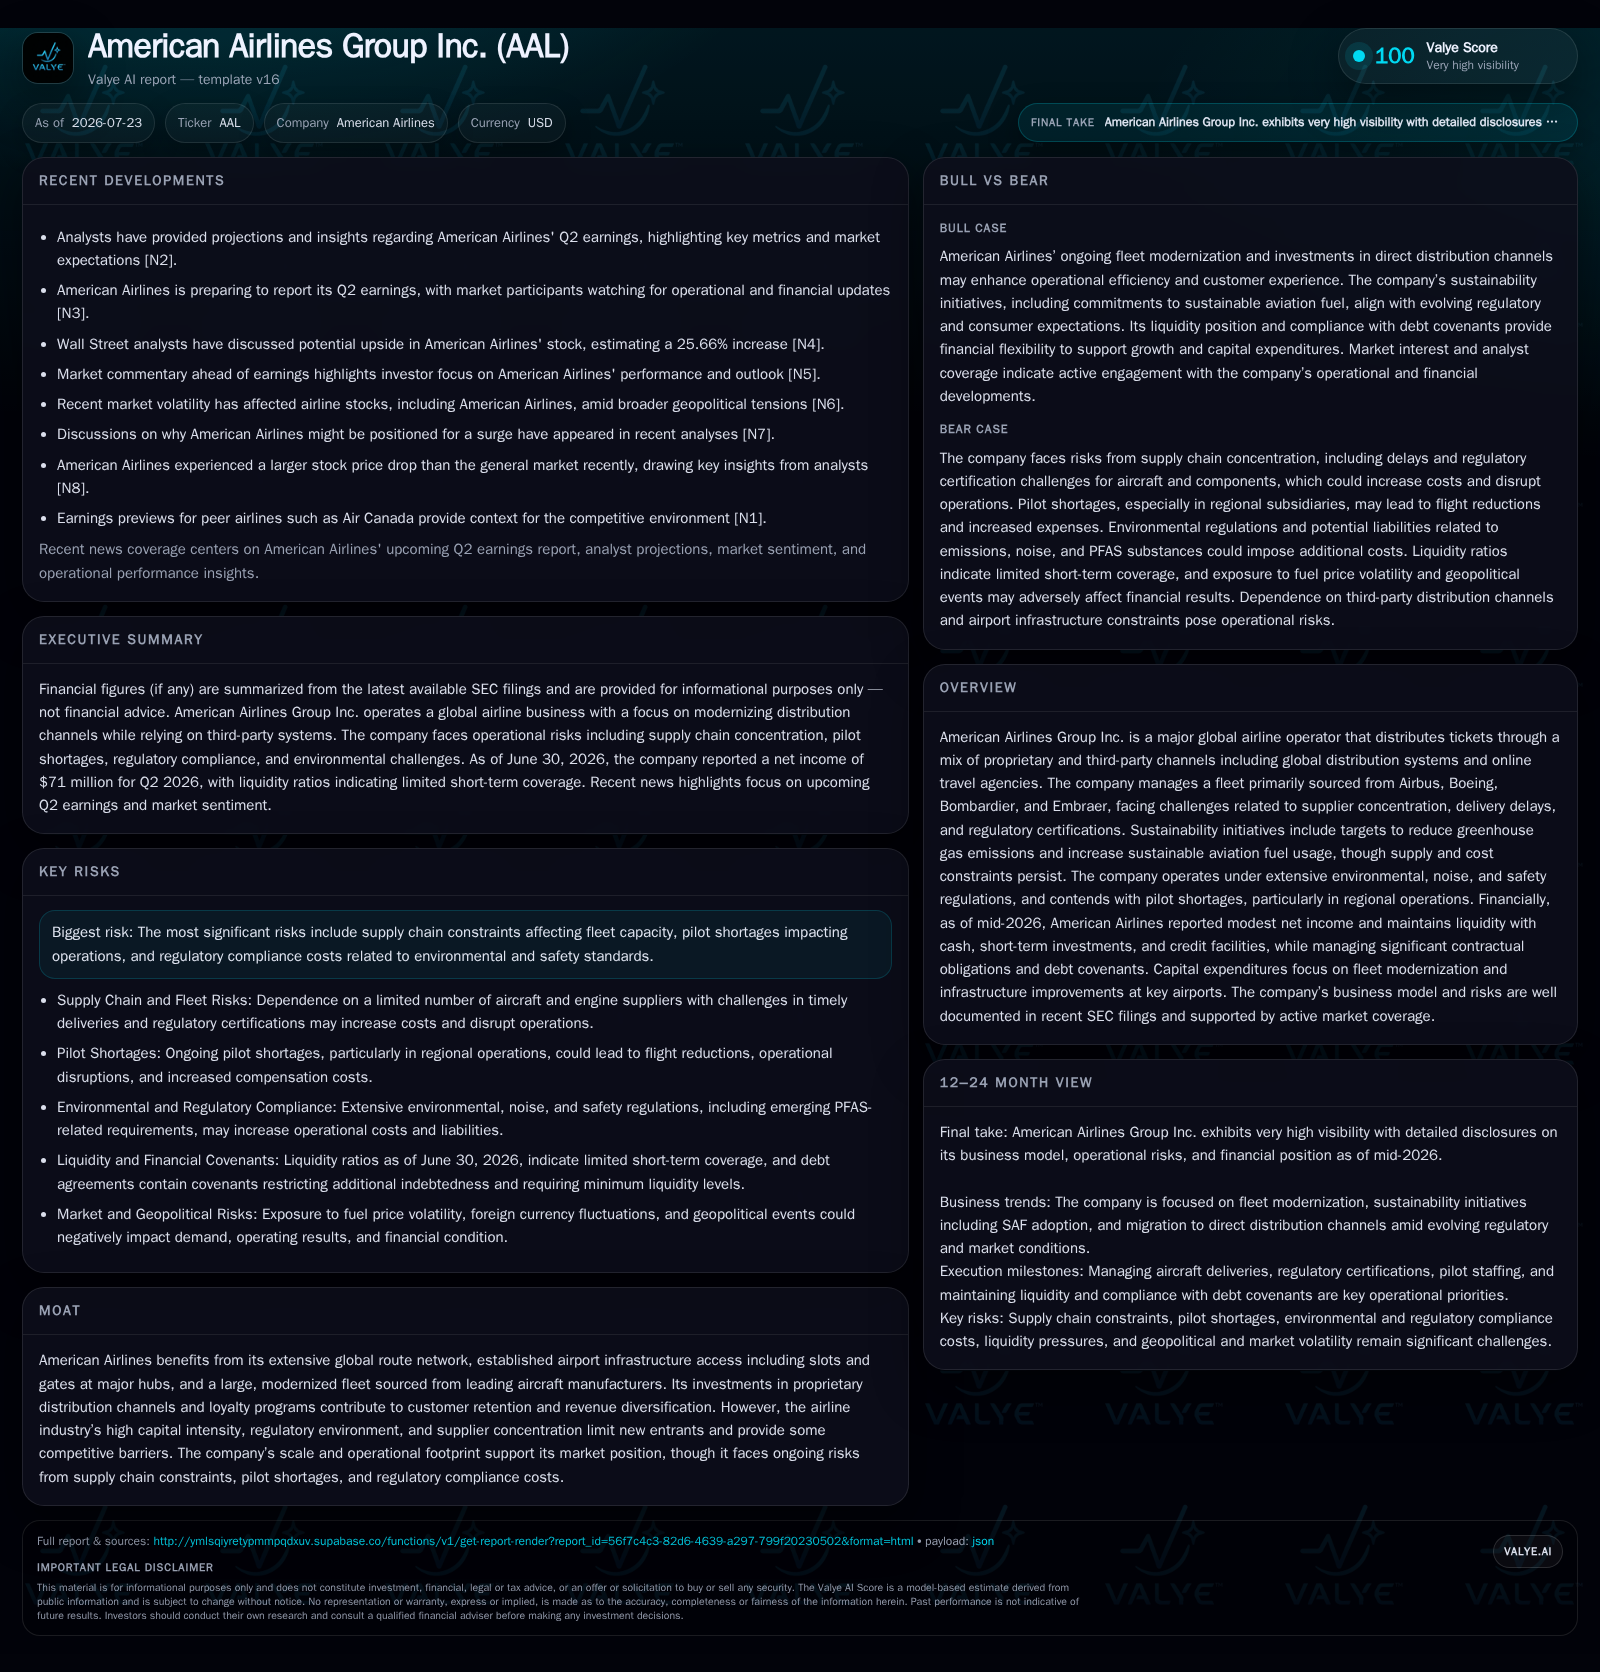
American Airlines Group Inc.'s Q2 2026 disclosures reveal modest increases in available seat miles and stable load factors amid ongoing pilot shortages and supplier-delayed fleet renewal. The airline advances its proprietary digital channels to improve revenue mix while wrestling with elevated operating costs driven by fuel volatility and sustainability commitments. Delivery delays from Airbus and Boeing constrain capacity scaling, while regional operational limitations reflect persistent industry-wide pilot scarcity. Liquidity remains sufficient despite substantial net debt, providing financial flexibility as the company balances growth ambitions with cost control.
Q2 Operating Dynamics Highlight Network Capacity and Load Factor Adjustments
American Airlines reported a modest increase in available seat miles (ASM) for the second quarter of 2026, reflecting deliberate network expansion efforts focused on strengthening hub connectivity and international routes [S2]. Despite this capacity growth, regions reliant on American Eagle’s fleet exhibited constrained ASM ramp-up due to ongoing pilot shortages—a bottleneck that restricts operational scalability notably at the regional level [S1],. Passenger load factors remained steady compared with prior quarters, signaling sustained consumer demand resilience even as macroeconomic headwinds temper volume acceleration [S2]. However, cost per available seat mile (CASM) experienced upward pressure primarily from fluctuating jet fuel prices and increased labor expenses including wages and benefits—factors that collectively challenge margin recovery prospects [S1]. This nuanced balance between expanding seat inventory while managing unit costs underscores the complex operating environment incumbent on legacy carriers like American Airlines.
Channel Shift Toward Direct Distribution Enhances Revenue Mix but Competition Persists
The company's sales strategy involves a multi-channel distribution model encompassing both proprietary platforms—such as its direct online booking system—and third-party global distribution systems (GDSs) including Amadeus and Sabre, alongside online travel agencies (OTAs) like Expedia [S1]. Management emphasizes a strategic priority to migrate customers toward the lower-cost direct channels, where revenue capture rates are higher due to reduced intermediated fees and greater ancillary upsell opportunities like baggage fees or premium seating [S1]. This digital shift is critical given that third-party channels impose costs that dilute per-passenger yields. Nevertheless, American's reliance on established GDS networks remains significant owing to their entrenched relationships with corporate travel management companies and conventional travel agents targeting business travelers. Compared to peers such as Delta Air Lines who have also invested heavily in digital transformation, American’s channel diversification affords competitive resilience but demands ongoing investment in user experience enhancements to sustain long-term loyalty program engagement.
Fleet Renewal Risks Persist Amid Delivery Delays from Airbus and Boeing Concentration
American Airlines' fleet renewal plans face acute risk from supplier concentration that centers on Airbus and Boeing for mainline aircraft acquisitions plus Bombardier and Embraer for regional jets [S1]. Prolonged delivery delays from these manufacturers impair the company’s ability to timely augment capacity aligned with demand growth forecasts. Such delays create operational challenges including increased maintenance burdens on older airframes—impacting maintenance, repair, and overhaul (MRO) cycles—and elevate capital intensity as existing aircraft age beyond optimal replacement horizons [S1]. Given the industry-wide backlog at major OEMs triggered by supply chain disruptions over recent years, American's exposure is emblematic of structural challenges across legacy carriers. While competitors similarly manage this supplier dependency risk, American's large-scale fleet modernization plans hinge materially on fulfillment timelines. Any further postponement could compress range of future capacity output or force suboptimal strategic scheduling decisions.
Pilot Labor Market Pressures Limit Regional Operational Upside
Consistent with sector-wide trends, American Airlines faces acute pilot shortages that disproportionately constrain its regional subsidiary operations under American Eagle, [S1]. This limitation restricts utilization rates on regional aircraft which typically serve as feeders into larger hubs. The pilot scarcity arises from prolonged pipeline deficiencies in training throughput combined with retention challenges exacerbated by competitive labor markets post-pandemic. Such constraints inhibit ASM growth potential within regional segments—even when local passenger demand would permit fuller deployment—and thereby dampen overall network efficiency. Industry peers including United Airlines report comparable pressures which collectively stress scheduling robustness and increase irregular operations risks. American's strategic response entails targeted recruitment incentives but structural shortages remain a significant execution risk for near-term capacity gains.
Sustainability Commitments Clash With Cost Pressures From SAF Adoption Challenges
American Airlines has articulated ambitious greenhouse gas reduction goals involving increased use of sustainable aviation fuels (SAF), positioning itself as an early mover among legacy carriers addressing regulatory-driven emissions requirements [S1]. However, these targets rest on expectations of future technology scale-up by third-party SAF producers—a supply currently limited in commercial volume—and come with substantially higher unit costs relative to conventional jet fuel [S1]. Consequently, SAF adoption represents an operational cost premium placing near-term margin pressure amid volatile fuel markets. Further complicating uptake are uncertainties tied to planned production facilities relying on unproven technologies or lacking final financing approvals. This tension between sustainability aspirations and economic realities reflects a broader industry predicament where airlines must balance ESG-driven capital allocation against immediate profitability imperatives. Moreover, heightened scrutiny around "greenwashing" risks mandates transparent communication strategies to mitigate regulatory or reputational exposures.
Earnings Risk Factors: Fuel Price Volatility and Regulatory Cost Headwinds
Fuel expenses remain a dominant variable cost affecting American Airlines’ operating margin variability [S1], [S2]. Recent quarterly filings reiterate the company’s sensitivity to jet fuel price swings, which directly influence ticket pricing strategies as well as discretionary consumer travel demand elasticity [S1]. Additionally, fluctuations in foreign currency exchange rates—particularly involving the Euro, Canadian dollar, British pound sterling, and Latin American currencies—compound financial complexity given the company's extensive international footprint [S2]. Regulatory compliance costs are another significant overhead factor; environmental taxes related to emissions coupled with stringent safety protocols drive incremental spending requirements that amplify cost structure rigidity [S1]. These dynamics reinforce an operating profile subject to wide external shocks beyond managerial control.
What to Watch: Metrics for Margin Recovery and Execution Milestones Into H2 2026
Key performance indicators warranting close observation include CASM excluding fuel & special items—a proxy for underlying operational cost discipline—as well as passenger yield trends signaling pricing power amidst competition [S3], [S2]. Load factor trajectories remain vital for assessing demand momentum relative to deployed ASMs. The effectiveness of channel migration towards proprietary booking platforms can be gauged through metrics like ancillary revenue per passenger which tie directly into margin uplift potential. On the supply side, advance tracking of new aircraft deliveries from Airbus/Boeing will elucidate whether capacity expansion forecasts align with operational realities. Similarly, monitoring pilot workforce availability informs feasible ASM growth ceilings particularly within regional services. These discrete indicators collectively determine whether management’s strategy translates into sustainable margin improvement during the second half of 2026.
Financial Profile Discussion: Liquidity Buffer Supports Strategy Despite Leverage
American Airlines maintains robust liquidity capacity complemented by revolving credit facilities to support ongoing operations and strategic investments amid uncertain external headwinds [S2]. As of June 30, 2026, current assets stood at approximately $14.3 billion versus current liabilities near $26.8 billion resulting in a current ratio of about 0.53 indicative of typical airline working capital constraints given capital-intensive operations [F1]. Total debt was reported near $28.6 billion with net debt adjusted for cash approximating $27.4 billion reflecting significant leverage levels consistent with industry norms among major network carriers emphasizing scale over balance sheet deleveraging [F1]. Interest rate shifts also affect financing costs given substantial variable-rate exposure outlined in filings [S2]. Nevertheless liquidity buffers appear adequate for near-term obligations while facilitating capital expenditures focused on fleet renewal and technology enhancements crucial for competitive positioning.
volatile inputs like fuel prices, pilot hiring progress particularly in regional flights, receipt schedules for new aircraft deliveries, along with traction in shifting distribution mix toward direct customer engagement channels as discerningly reflective gauges of business trajectory through late 2026.
Disclaimer: This analysis is provided for informational purposes only without any investment research view or advice. It reflects interpretation of publicly available data up to July 23, 2026.
Disclaimer: This is research-only, informational analysis and not investment advice. It may include AI-generated interpretation and general industry context. Always verify important details using primary sources.

Comments