
Green Brick Partners Strengthens Backlog Amid Strategic Land Controls in Sunbelt Markets
Latest quarterly filings highlight Green Brick’s focused land acquisition, backlog growth, and conservative leverage approach in key growth regions.
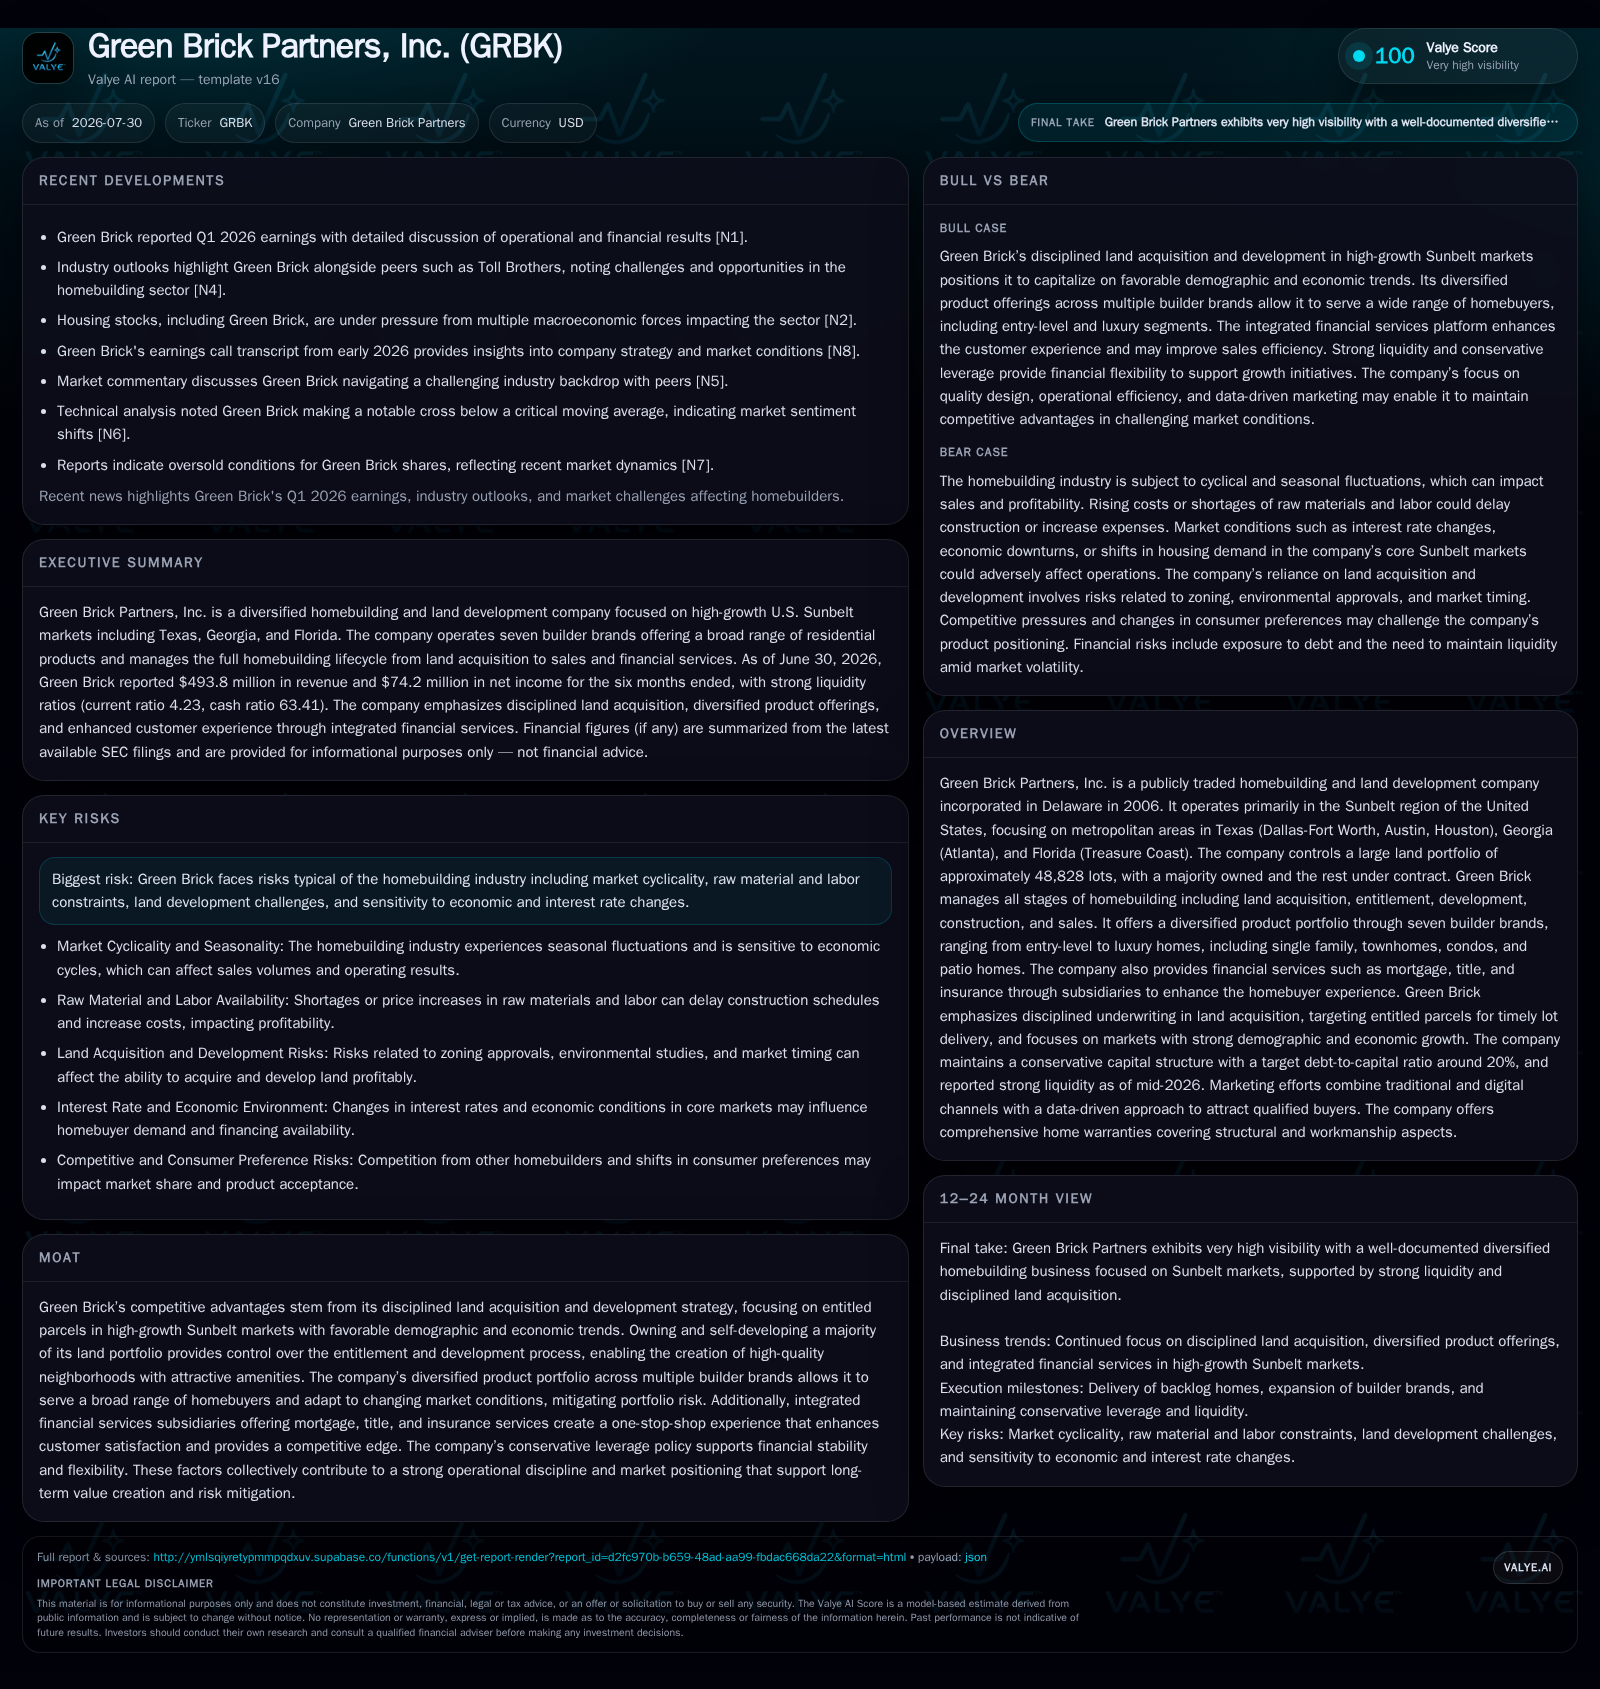
Green Brick Partners operates as a diversified homebuilder and lot developer primarily across high-growth Sunbelt metropolitan areas. The latest Q2 2026 filing shows gross home sale revenues of $920 million with a stable land sale contribution. The company maintains nearly 49,000 lots under contract or ownership, supporting its multi-brand homebuilding across price tiers. Integrated mortgage and title services complement the core homebuilding operations. Financially, the firm exhibits manageable leverage supported by a sizable cash position and refinanced unsecured revolving credit facility extended through 2028. Backlog trends and operational discipline underpin resilience amid cyclical housing market risks.
Recent Operating Update
Green Brick Partners' latest quarterly report for Q2 2026 presents a stable operating profile with residential units generating approximately $920 million in revenues; land sales added around $17 million to the period's top line [S2]. Revenues are predominantly recognized at the point in time of home delivery, reflecting traditional house sale transactions. This underscores that the company’s primary earnings driver remains new home construction and sales rather than ancillary land dispositions.
The termination of its secured revolving credit facility during Q1 indicates an optimization of capital structure alongside maintaining liquidity via an unsecured revolving credit facility, which was amended in late 2025 to reduce borrowing costs and extended to December 2028 [S4]. Warehouse facilities supporting GRBK Mortgage’s loan origination decreased borrowings to roughly $34.6 million as of June-end from nearly $46.4 million year-end 2025 levels, consistent with active mortgage loans being sold in the secondary market shortly after origination [S2].
An amendment pushed out the minority partner’s put option on GRBK GHO equity stake from April 2027 to April 2030, delaying potential buyout obligations and offering longer-term financial planning flexibility [S16]. Share repurchases continue at a measured pace; approximately $16.5 million spent in the first half reflects prudent capital return alongside preserving cash for growth and contingency needs [S10/S11].
Business Model
Green Brick derives most revenue from home sales executed through its seven distinct builder brands spanning entry-level to luxury market segments [S1]. This multi-brand strategy allows adaptation to varying local demand profiles and market cycles while broadening appeal across diverse buyer demographics. Offering various residential types — single-family homes, townhomes, condos, patio homes — enhances market coverage and mitigates concentration risk within any single product segment
Integral to Green Brick’s model is its large lot portfolio: about 48,828 home sites owned or under contract primarily located in Texas metros (Dallas-Fort Worth, Austin, Houston), Atlanta (Georgia), and Florida's Treasure Coast region. Controlling such extensive entitled land is a competitive advantage enabling disciplined lot development tailored to local demand and pricing dynamics [S1]. By owning most of its lots versus third-party acquisitions only upon sale obligation fulfillment conditions (like zoning entitlement or environmental approvals), Green Brick retains tighter margin control and timing flexibility
Aside from construction and development revenue streams, Green Brick operates financial services subsidiaries specializing in mortgage origination, title insurance, and homeowner insurance — these services smooth transaction frictions for buyers while capturing additional fee-based income [S9]. Selling loans quickly post-origination into the secondary market limits credit exposure but generates gain-on-sale revenue impacting financial service segment profitability metrics
Industry Structure and Competitive Position
Operating largely within Sunbelt metropolitan hubs characterized by robust population growth supports structural demand drivers such as migration inflows and job creation. This regional focus aligns with demographic advantages over slower growth areas nationally.
In comparison to peers like D.R. Horton or Lennar Corporation — both active nationally — Green Brick positions itself as a regional player with deep expertise in specific markets. Such focus enables somewhat differentiated risk profiles but can expose it to localized economic slowdowns or regulatory hurdles.
The company’s emphasis on controlling entitled land contrasts with smaller builders that may rely predominantly on third-party-developed lots or speculative buying at earlier land phases. This discipline benefits margin stability but requires capital intensity and operational skill in entitlement processes.
Integrated financial subsidiaries are also a hallmark shared broadly by larger peers (e.g., Lennar’s financial services arm), leveraging cross-selling synergies while boosting overall transaction economics.
Growth Drivers
Key growth vectors include continuing population expansion in core metro areas driving housing demand across segments from first-time buyers to move-up customers seeking suburban master-planned communities with amenities.
Maintaining a large backlog ensures near-term revenue visibility; management expects almost full delivery of current backlog within the calendar year barring cancellations consistent with historical norms [S1]. This backlog acts as both a revenue pipeline and a signal of sustained market absorption rates.
Expanding product diversification through multiple builder brands allows tactical shifts amidst changing consumer preferences or economic conditions—critical given volatility often seen across different price points during housing downturns.
Continuous land acquisition aligned with entitlement success also fuels future inventory replenishment essential for sustainable volume growth.
Financial service offerings enhance buyer accessibility to financing solutions improving conversion rates while generating incremental fee income enhancing margins beyond pure construction profits.
Risks and Growth Constraints
Cyclicality inherent in housing markets leads to volatility tied closely to macroeconomic trends including employment changes, interest rate movements affecting mortgage affordability, consumer confidence swings, and inflation impacting raw materials/labor costs.
Interest rate hikes directly pressure homebuyer financing capacity; although Green Brick mitigates this partly through own mortgage origination platforms facilitating competitive loan products.
Land entitlement delays or failures can throttle lot supply disrupting build schedules or elevating costs.
Labor shortages combined with rising material expenses challenge cost control efforts potentially compressing gross margins on home sales if not fully passed onto buyers due to competitive pressures.
Geographic concentration within select Sunbelt regions provides strategic focus but also heightens exposure to localized downturns or regulatory changes compared with more geographically diversified national players.
Cancellation rates above normal historical ranges would reduce backlog conversion flow affecting near-term revenue recognition consistency.
What To Watch Next
Monitoring backlog unit trends against cancellation rates will provide early indicator signals of underlying demand health across Green Brick’s markets.
Further amendments or refinancing activity related to debt facilities could influence capital flexibility amid evolving cyclical uncertainty.
Updates on lot acquisition pace combined with entitlement progress will illuminate inventory pipeline robustness relative to projected housing deliveries.
Performance of financial services segments through net gains on mortgage loan sales will be relevant given their contribution margin characteristics differing from homebuilding operations.
Successful retention of builder brand positioning alongside continued diversification between entry-level to luxury tiers may help buffer margin erosion risks if macroeconomic pressures intensify.
Financial Profile Discussion
As of June 30, 2026, Green Brick held cash and equivalents totaling approximately $132 million and borrowings on warehouse lines of credit stood at about $34.6 million, down from $46.4 million at year-end 2025, reflecting active asset turnover consistent with mortgage loan sales in the secondary market [S2]. The company’s unsecured revolving credit facility, totaling $330 million and maturing in late 2028, provides ample liquidity headroom and was amended in late 2025 to reduce borrowing costs, indicating lender confidence in management’s financial stewardship [S4].
Warranty reserves declined sequentially suggesting improved defect rectification efficiency or lower claim frequency—a positive operating signal within cost control monitoring [S14]. Strengthening gross margins documented post-restatement adjustments further validate operating discipline amidst inflationary pressures though ongoing vigilance is needed given external cost headwinds [S8/S13].
-- This analysis utilizes publicly filed SEC reports up to July 29, 2026. It synthesizes operating data alongside industry context without providing investment advice or valuation commentary.
Disclaimer: This is research-only, informational analysis and not investment advice. It may include AI-generated interpretation and general industry context. Always verify important details using primary sources.

Comments