Albemarle’s Global Lithium and Bromine Operations Amidst Financial Pressures
Albemarle Corporation’s vast mineral footprint contrasts recent losses, highlighting complex operational and partnership dynamics.
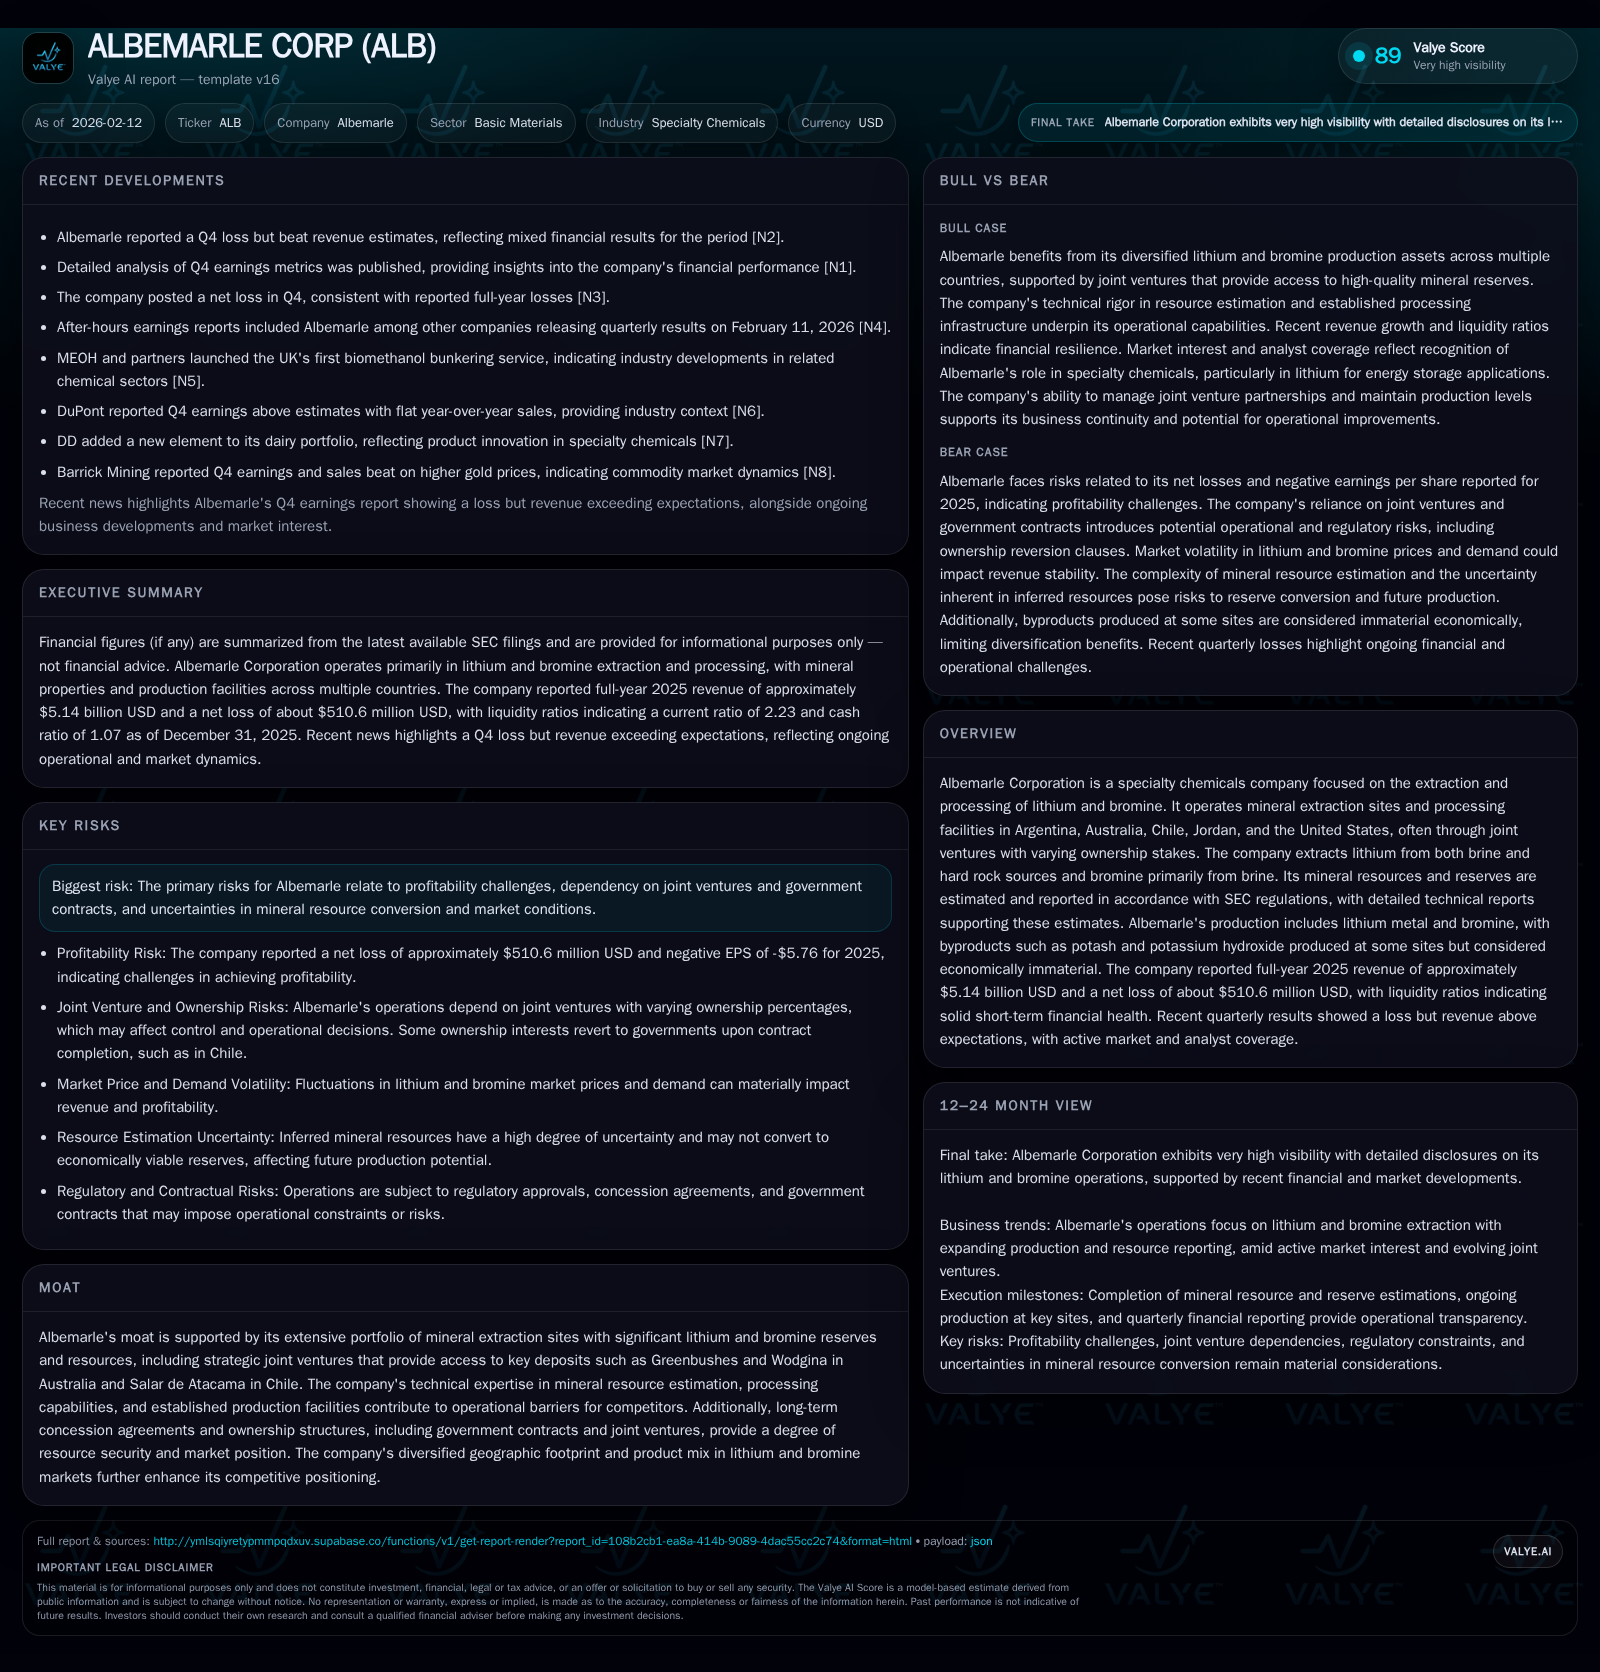
Albemarle Corp operates an extensive network of lithium and bromine extraction assets across five countries, leveraging joint ventures and government contracts to secure critical resources. Despite a record $5.14 billion revenue in 2025, the company faced a net loss exceeding $510 million, pointing to underlying margin pressures amid operational scale. Its competitive moat is underpinned by long-term mineral rights, technical expertise, and diversified geographic exposure, but risks linger from joint venture dependencies and fluctuating market conditions. Strategic restructuring efforts and exploration projects signal a balancing act between growth aspirations and financial health.
The Global Lithium and Bromine Mosaic: Albemarle’s Asset Footprint
Albemarle Corporation stands as a prominent player in specialty chemicals, with a core focus on lithium and bromine extraction from geographically diverse sites spanning Argentina, Australia, Chile, Jordan, and the United States [S1]. This dispersion encompasses both brine-based lithium extraction—primarily in Chile's Salar de Atacama (100% ownership) and Argentina's Antofalla project (100%, exploration stage)—and hard rock spodumene mining concentrated at Australian locations Greenbushes (49%) and Wodgina (50% following the MARBL restructuring completed in October 2023). Additionally, US assets include the Silver Peak brine operation (100%) among others.
Bromine production operations are principally located at the Safi joint venture in Jordan (50%) and Magnolia facility in Arkansas (100%), showcasing Albemarle’s broad chemical product mix beyond lithium [S1]. The diversified extraction processes require distinct technical capabilities: brine mining involves fluid pumping and evaporation cycles typical of salar environments, whereas hard rock mining demands processing of spodumene concentrate refined onsite or elsewhere.
This asset mosaic not only mitigates geographical supply risks but also complicates operational management due to different regulatory regimes, ownership structures—some sites are controlled exclusively, others shared—and geological characteristics influencing extraction costs.
Navigating Joint Ventures and Government Dependencies: Strategic Alliances Under the Lens
Key strategic alliances form pillars of Albemarle’s resource access yet introduce multilayered risk exposures. Notably, the Greenbushes mine operates under a Windfield joint venture with Albemarle owning a near half share (~49%), conferring partial control over one of the world’s highest-grade spodumene deposits [S1]. Similarly, the MARBL joint venture restructuring reduced Albemarle's Wodgina stake from 60% to an even 50%, altering both operational influence and attributable production volumes.
In Chile's Salar de Atacama site—entrenched through long-term concession contracts—the company faces eventual resource reversion clauses where ownership shifts back to the Chilean government post-contract fulfillment [S1]. Such arrangements secure resource tenure but add political dimension risks tied to government policy shifts.
Bromine operations rely on collaborative structures like JBC's Safi project (50%), emphasizing partnership dynamics that provide complementary technology or market reach while exposing Albemarle to joint decision-making complexities.
These intertwined relationships underpin resource security critical for global supply positioning but constrain unilateral operational flexibility. They also necessitate continual monitoring of political landscapes and partnership health to safeguard long-term viability.
Production Dynamics: Lithium & Bromine Output Trends with Technical Backing
In terms of output trends over recent years through 2025, Albemarle’s attributable lithium metal production has exhibited modest gains amid incremental expansion efforts. Lithium metal production reached approximately 42 thousand metric tonnes for full year 2025 compared with 39 thousand tonnes in both 2023 and 2024 [S1]. Breaking down by site:
- Greenbushes contributed around 19k mt consistently.
- Wodgina increased from around 7k mt in 2023 to roughly 8k mt by end-2025 after MARBL JV restructuring impact.
- Salar de Atacama expanded output from approximately 10k mt to nearly 14k mt over three years.
- Silver Peak maintained steady production near one thousand metric tonnes annually.
For bromine, total attributable production was stable—126 thousand metric tonnes in 2025 versus about 123k mt in prior years—with Magnolia site responsible for about half this volume [S1]. Byproducts like potash (Chile), potassium hydroxide (Jordan), elemental sulfur (Magnolia), while produced onsite, remain economically immaterial according to disclosures.
This stable but moderate growth pattern underscores constrained scalability within current asset configurations despite favorable long-term demand fundamentals for battery materials and specialty chemicals.
Decoding the Moat: Mineral Rights, Concession Tenure, and Technical Expertise
Albemarle’s moat fundamentally rests on its secured mineral rights portfolio validated through SEC-reporting compliant geological assessments classified into measured, indicated, inferred resources as well as proven/probable reserves [S1]. These are supported by qualified persons applying rigorous modifying factors ensuring viable mine planning accuracy—a significant barrier deterring new entrants lacking technical capability or capital.
Long-lived concession agreements such as those governing Salar de Atacama provide resource security that stretches beyond immediate supply needs. Similarly, patents or proprietary processing technologies applied at conversion facilities worldwide augment competitive defense by enhancing recovery efficiencies or lowering operating expenses.
Such entrenched tenure coupled with diversified geography buffers against regional disturbances or policy upheavals while crafting operational scale advantages difficult for smaller players to replicate rapidly.
Exploring Financial Underpinnings: Revenue Growth Amid Net Loss Realities
Financially, Albemarle recorded full calendar year revenues near $5.14 billion USD by close of 2025—a figure reflecting improved top-line performance exceeding analyst expectations per quarterly reports [F1][N2]. However, this growth contrasts sharply with concurrent net losses totaling approximately $510 million USD over the same period [F1][N2][N14].
The company maintains robust liquidity metrics highlighted by a current ratio approximating 2.23 derived from current assets of about $4 billion against current liabilities near $1.8 billion [F1]. Cash & equivalents hover just below $2 billion as of late September quarter-end [F1], enabling resilience amid profit setbacks.
This juxtaposition signals underlying cost escalations or non-cash charges impacting profitability despite stable cash flows or sales volume consistency—dynamics warranting deeper margin analysis.
Margins in Transition: Profitability Challenges and Operational Costs
Profitability constraints appear linked to multiple converging factors. Earnings commentary highlights cost pressures including energy prices for processing facilities operating brine evaporation ponds or high-energy hard rock concentrate refinement plants [N1][N2]. Moreover, joint venture accounting adjustments particularly stemming from MARBL restructuring have influenced equity method investment impacts on income statements [S1].
Commodity price fluctuations for lithium compounds amidst evolving battery material markets affect selling price realization power. Additionally, reported impairments or restructuring charges captured during fiscal periods manifest as notable contributors to overall net losses documented in earnings disclosures [N14][S1].
These elements collectively outline what appears less as operational failure than an ongoing realignment phase constrained by external cost factors coupled with internal portfolio transitions.
Risk Radar: Market Conditions, Resource Uncertainties, and Partnership Reliabilities
Albemarle’s own SEC filings lay bare principal risks effectively shaping future operational stability. Market volatility remains paramount; fluctuations in lithium pricing tied closely to electric vehicle sector adoption curves bear direct influence on margins [S1].
Resource conversion uncertainties reflect geological classification limitations where inferred resources lack sufficient certainty potentially impacting future reserve expansions or mine life calculations if exploration projects underdeliver [S1].
Joint ventures impose additional risk vectors —political shifts affecting contract terms—as seen with government reversion rights at certain sites or reliance on partners’ performance within collaborative extractive frameworks restrict standalone corrective actions [S1].
Together these factors constitute a balanced cautionary environment necessitating proactive mitigation approaches aligned with financial strategies.
Strategic Outlook: Balancing Expansion Initiatives Against Financial Health
Looking forward, Albemarle pursues exploration initiatives targeting promising lithium deposits such as Antofalla in Argentina (at pre-production stage) alongside Kings Mountain hard rock operation expansions within the United States [S1]. Managing participation levels post-MARBL JV restructuring reflects tactical recalibration aimed at optimizing capital deployment relative to expected returns.
Investor anticipation evidenced in recent pre-earnings analyses contemplates earnings beats which may hinge on cost controls unfolding alongside volume increases entering upcoming quarters [N6][N7]. The company balances imperative growth investments geared toward securing future supply dominance against present-day financial headwinds constraining bottom-line improvement trajectories.
Competitively positioned among specialty chemical producers focused on energy storage materials globally, Albemarle confronts ongoing sectoral challenges requiring careful navigation through partnership dynamics and market fluctuations while leveraging its asset base strengths documented extensively via regulatory filings [S1][F1].
Disclaimer: This report is for informational purposes only reflecting data as of early 2026 based on publicly available sources including SEC filings and market reports; it does not constitute investment advice or recommendations.
Disclaimer: This is research-only, informational analysis and not investment advice. It may include AI-generated interpretation and general industry context. Always verify important details using primary sources.
Comments