
ALERUS FINANCIAL CORP’s Diversified Model Moderates Growth and Pressure on Capital in 2025
The company's multi-segment approach supports stable revenue but tempers net income growth and capital returns amid competitive and regulatory pressures.
ALERUS FINANCIAL CORP's financial results through 2025 reveal a business balancing diversified revenue streams with margin and capital allocation challenges. Its banking, retirement and benefit services, and wealth management lines collectively contribute to a majority noninterest income base, supporting resilience despite subdued loan growth and deposit declines. Operating cash flows surged in 2025, reflecting improved working capital management, while net income declined slightly year-over-year. Capital adequacy remains solid, enabling consistent dividends with minimal share repurchase activity. However, regulatory constraints and cybersecurity risks pose ongoing operational considerations.
Company Overview and Business Model
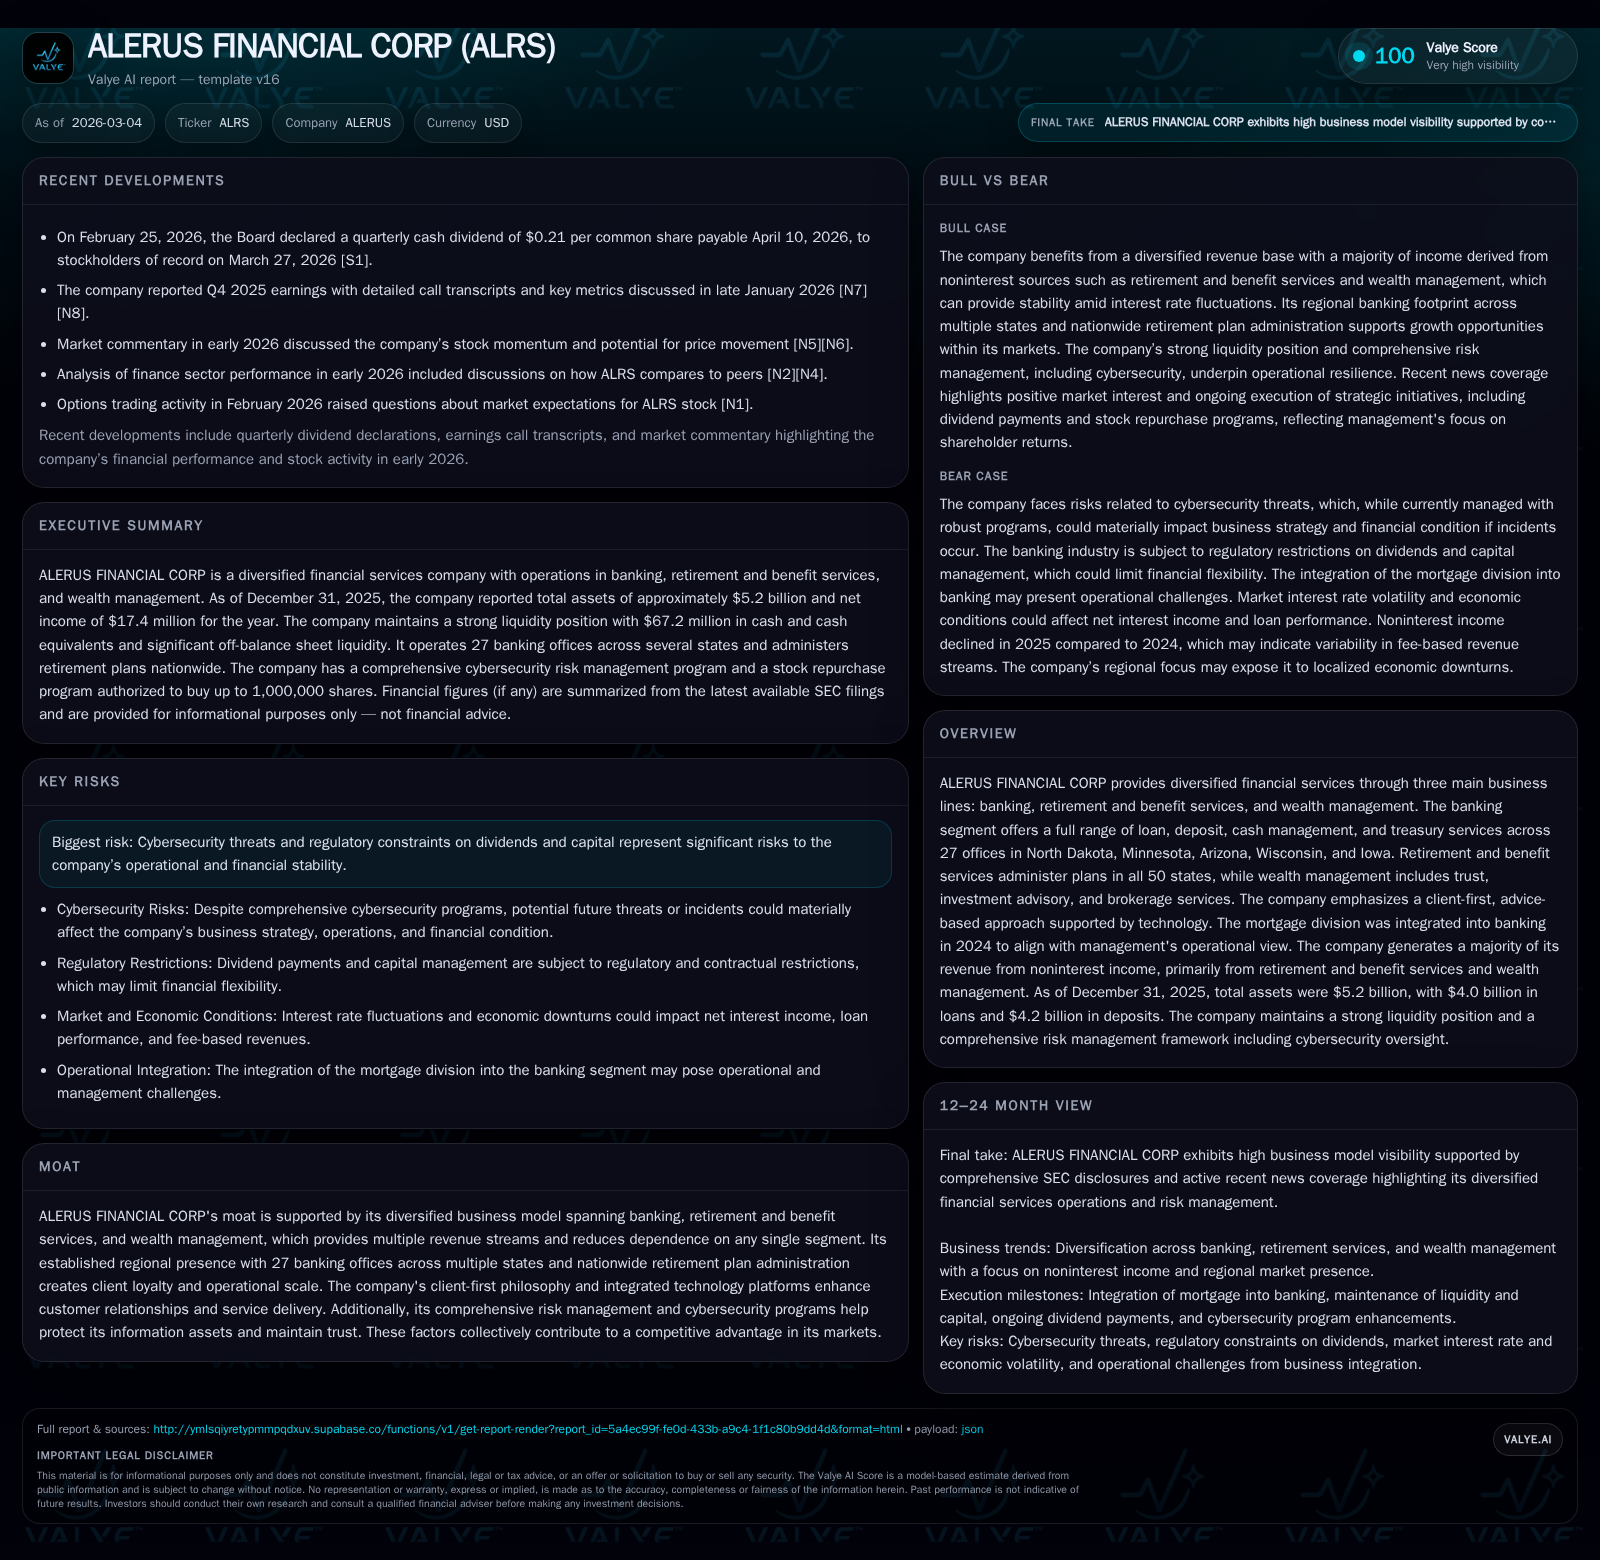
ALERUS FINANCIAL CORP provides diversified financial services across three primary lines: banking, retirement and benefit services, and wealth management [S1]. The banking division offers traditional loan products, deposits, cash management, and treasury functions delivered via a network of 27 offices spanning North Dakota, Minnesota, Arizona, Wisconsin, and Iowa [S1]. Complementing this regional banking footprint is the nationwide reach of its retirement and benefit services administering plans across all fifty states and wealth management that encompasses trust services, investment advisory, and brokerage offerings [S1]. The firm emphasizes a client-first philosophy underscored by advice-based engagement facilitated through technology platforms that seek to integrate service delivery efficiently [S1]. In 2024, the mortgage division was absorbed into the banking segment aligning operational focus for the company [S1]. This diversification underpins a revenue mix wherein noninterest income—primarily generated by retirement services and wealth management—forms the bulk of total revenues.
Historical Financial Performance
The company's annual financial data from recent years illustrates modest top-line growth alongside fluctuating profitability driven by operating efficiencies and market conditions [F1]. Net income registered at $17.4 million for FY2025 representing a slight decline of about 1.9% compared with $17.8 million in FY2024. Despite this dip in bottom-line earnings, operating cash flow soared by over 130%, reaching roughly $67.5 million in FY2025 from about $29 million the previous year [F1]. This improvement indicates better cash conversion dynamics or changes in working capital management.
Capital expenditures decreased sharply by about 30% year-over-year to nearly $8.7 million reflecting possible consolidation or controlled investments relative to prior years’ elevated spending [F1]. Shareholders’ equity grew materially from approximately $495 million at end-2024 to nearly $565 million at end-2025 driven by retained earnings accumulation [F1]. Dividend payments rose to over $20 million annually showcasing steady shareholder return commitment while share repurchases remained marginal at under $1 million after higher buybacks in previous years [F1].
Historical performance (annual)
| FY | Net ($mm) | CFO ($mm) | Capex ($mm) | Net YoY |
|---|---|---|---|---|
| 2025 | 17 | 68 | 9 | -1.9% |
| 2024 | 18 | 29 | 12 | +52.0% |
| 2023 | 12 | 29 | 3 | -70.8% |
| 2022 | 40 | 103 | 2 |
Source: SEC companyfacts cache [F1].
Capital returns and efficiency (annual)
| FY | Div ($mm) | Buybacks ($mm) | FCF ($mm) |
|---|---|---|---|
| 2025 | 21 | 1 | 59 |
| 2024 | 15 | 0 | 17 |
| 2023 | 15 | 7 | 26 |
| 2022 | 13 | 1 | 101 |
Source: SEC companyfacts cache [F1].
Net income YoY decline noted for most recent fiscal year; operational cash flow gains imply enhanced efficiency or working capital leverage.
Loan Portfolio and Deposits
As of December 31, 2025, total loans outstanding approximated $4 billion—a stable figure compared to the prior-year balance [S18][S26]. This portfolio comprises commercial loans (including commercial real estate), residential real estate loans such as first lien mortgages and home equity lines of credit (HELOCs), as well as consumer loans [S14][S15][S18]. Specifically:
- Commercial loans compose roughly two-thirds of the portfolio.
- Residential real estate lending accounts for about one-third with a variety of lien positions.
- Consumer loans represent a minor portion but provide additional diversification.
Deposit liabilities totaled about $4.2 billion as of end-2025—a decrease of approximately $186 million or -4.3% compared to the prior year-end figure of about $4.38 billion [S22][S27]. Most notably:
- Noninterest-bearing deposits declined by over $95 million.
- Interest-bearing deposits decreased roughly $90 million with time deposits seeing significant contraction due partly to maturities not renewed including brokered CDs.
- Interest-bearing demand deposits increased moderately offering some offset [S27].
Deposit cost also moderated with interest-bearing deposit costs falling from about 3.21% in FY2024 to roughly 2.63% in FY2025 reflecting easing market rates during the year [S9]. The company competes regionally for local depositor dollars applying competitive pricing strategies while leveraging core deposits to fund asset growth.
Revenue Composition and Segment Highlights
The company derives a majority portion of its revenues from noninterest sources tied primarily to retirement and benefit services plus wealth management operations that enjoy broader geographic reach beyond its physical banking locations [S1]. These recurring fee-based businesses stabilize overall income against potential volatility tied to interest rate fluctuations or competitive credit markets affecting lending margins.
Banking operations contribute net interest income stemming from the loan portfolio less funding costs primarily derived from deposits plus other transaction fees connected with deposit accounts or treasury services [N4][S1]. The integration of mortgage operations within the banking unit intends to align originations with funding capabilities more seamlessly.
Risk Management: Cybersecurity Focus
An extensive cybersecurity framework forms part of ALERUS’s enterprise risk management given increasing threat vectors faced by financial firms globally [S1]. Key features include:
- Proactive identification and assessment utilizing monitoring systems with real-time threat detection.
- Integration within broader risk policies ensuring prioritized mitigations.
- Rigorous third-party vendor oversight addressing supply chain risks.
- An internal dedicated cybersecurity team led by an experienced director with over three decades expertise overseeing controls across all business geography.
- Regular workforce training programs alongside external expert involvement for independent assessments.
- Governance accountable both at executive officer level and board committees receiving quarterly detailed updates on cyber risk status.
These measures build customer trust through safeguarding information assets crucial to ALERUS’s advisory-led business model.
Liquidity Position and Capital Structure
Liquidity remains robust with reported on-balance sheet liquid assets around $569 million including cash balances approximating $67 million as well as federal funds sold plus available securities collateralized for additional borrowings [S4][S5][S22]. The company complements this with off-balance sheet liquidity approximating $2.2 billion derived from Federal Home Loan Bank (FHLB) borrowing capacity backed by pledged collateral ($2.1 billion), Federal Reserve discount window access ($40 million), unsecured credit lines ($127 million), and brokered deposit capacities [S5][S12][S27].
Capital ratios underscore sound capitalization metrics providing resilience amid varying economic cycles:
- Common equity tier one ratio near or above ~10%
- Tier one capital between ~10–11%
- Total capital ratios exceeding ~12% [S19]
Pledged loans amounting to over $2 billion secure FHLB advances evidencing conservative collateralization frameworks that support diverse funding channels [S14][S23].
Returns and Capital Allocation Strategy
ROE approximation is modest at circa 3% based on net income relative to equity size as of FY2025 ($17.4M / ~$565M equity) but reflects ongoing investments into infrastructure alongside competitive pressures compressing margins over recent periods [F1]. Dividend payments continue on a quarterly basis totaling just above $20 million demonstrating consistent shareholder return policy aligned with earnings—up from lower dividend levels several years ago indicating calibrated payout growth [F1][S21].
Share repurchases have been limited recently although programs authorize up to one million shares subject to market conditions; actual executed buybacks amounted to less than one million dollars worth for FY2025 suggesting cautious capital deployment amidst uncertain macroeconomic factors [F1][S21].
Capital expenditures dropped significantly in recent years reflecting normal capex cycles after elevated prior spending phases supporting technology adoption or branch optimization initiatives consistent with the firm's emphasis on platform modernization noted in corporate disclosures [F1][N4][S21].
Growth Outlook And Milestones
While specific guidance is not provided publicly, industry commentary highlights expectations for sustained earnings growth supported by incremental improvements across core segments [N6][N3][N1]. Key milestones include continued integration efficiencies post mortgage division consolidation within banking operations along with expanding fee-based retirement plan administration nationally leveraging scale advantages [N3][N6].
Monitoring focus also rests on maintaining deposit stability amid competitive rate environments coupled with prudent credit quality oversight particularly within commercial portfolios exposed regionally [N11][N3]. Technology enhancements aimed at improving client engagement platforms represent strategic priorities potentially impacting future revenue diversification positively.
Summary
ALERUS FINANCIAL CORP operates a diversified financial services platform balancing regional banking breadth with broader national retirement services and wealth management reach that together underpin revenue diversity reducing cyclical sensitivity inherent in pure lending franchises. Financial performance through FY2025 shows modest pressure on net income but strong operational cash flow improvements reflecting underlying business resilience and disciplined working capital management amid a slightly contracted deposit base. Robust liquidity coupled with solid capitalization supports consistent dividends though limited share buybacks illustrate measured capital allocation given macro uncertainties and regulatory considerations. A vigilant stance on cybersecurity risk further anchors operational stability vital for sustaining client trust across advisory-led segments critical to ALERUS’s strategy going forward. Watch points focus on sustaining cross-segment revenue growth while managing credit quality headwinds within banking loans alongside continued investment returns consistency driving shareholder value amidst evolving external challenges.
This report is prepared solely for informative purposes without any recommendation or investment advice.
Disclaimer: This is research-only, informational analysis and not investment advice. It may include AI-generated interpretation and general industry context. Always verify important details using primary sources.
Comments