
American Water Works: Analyzing 2025’s Earnings Surge and Regulatory Dynamics
A detailed review of American Water Works’ financial performance in 2025 highlights the interplay between its regulatory framework, capital investments, and liquidity challenges shaping future prospects.
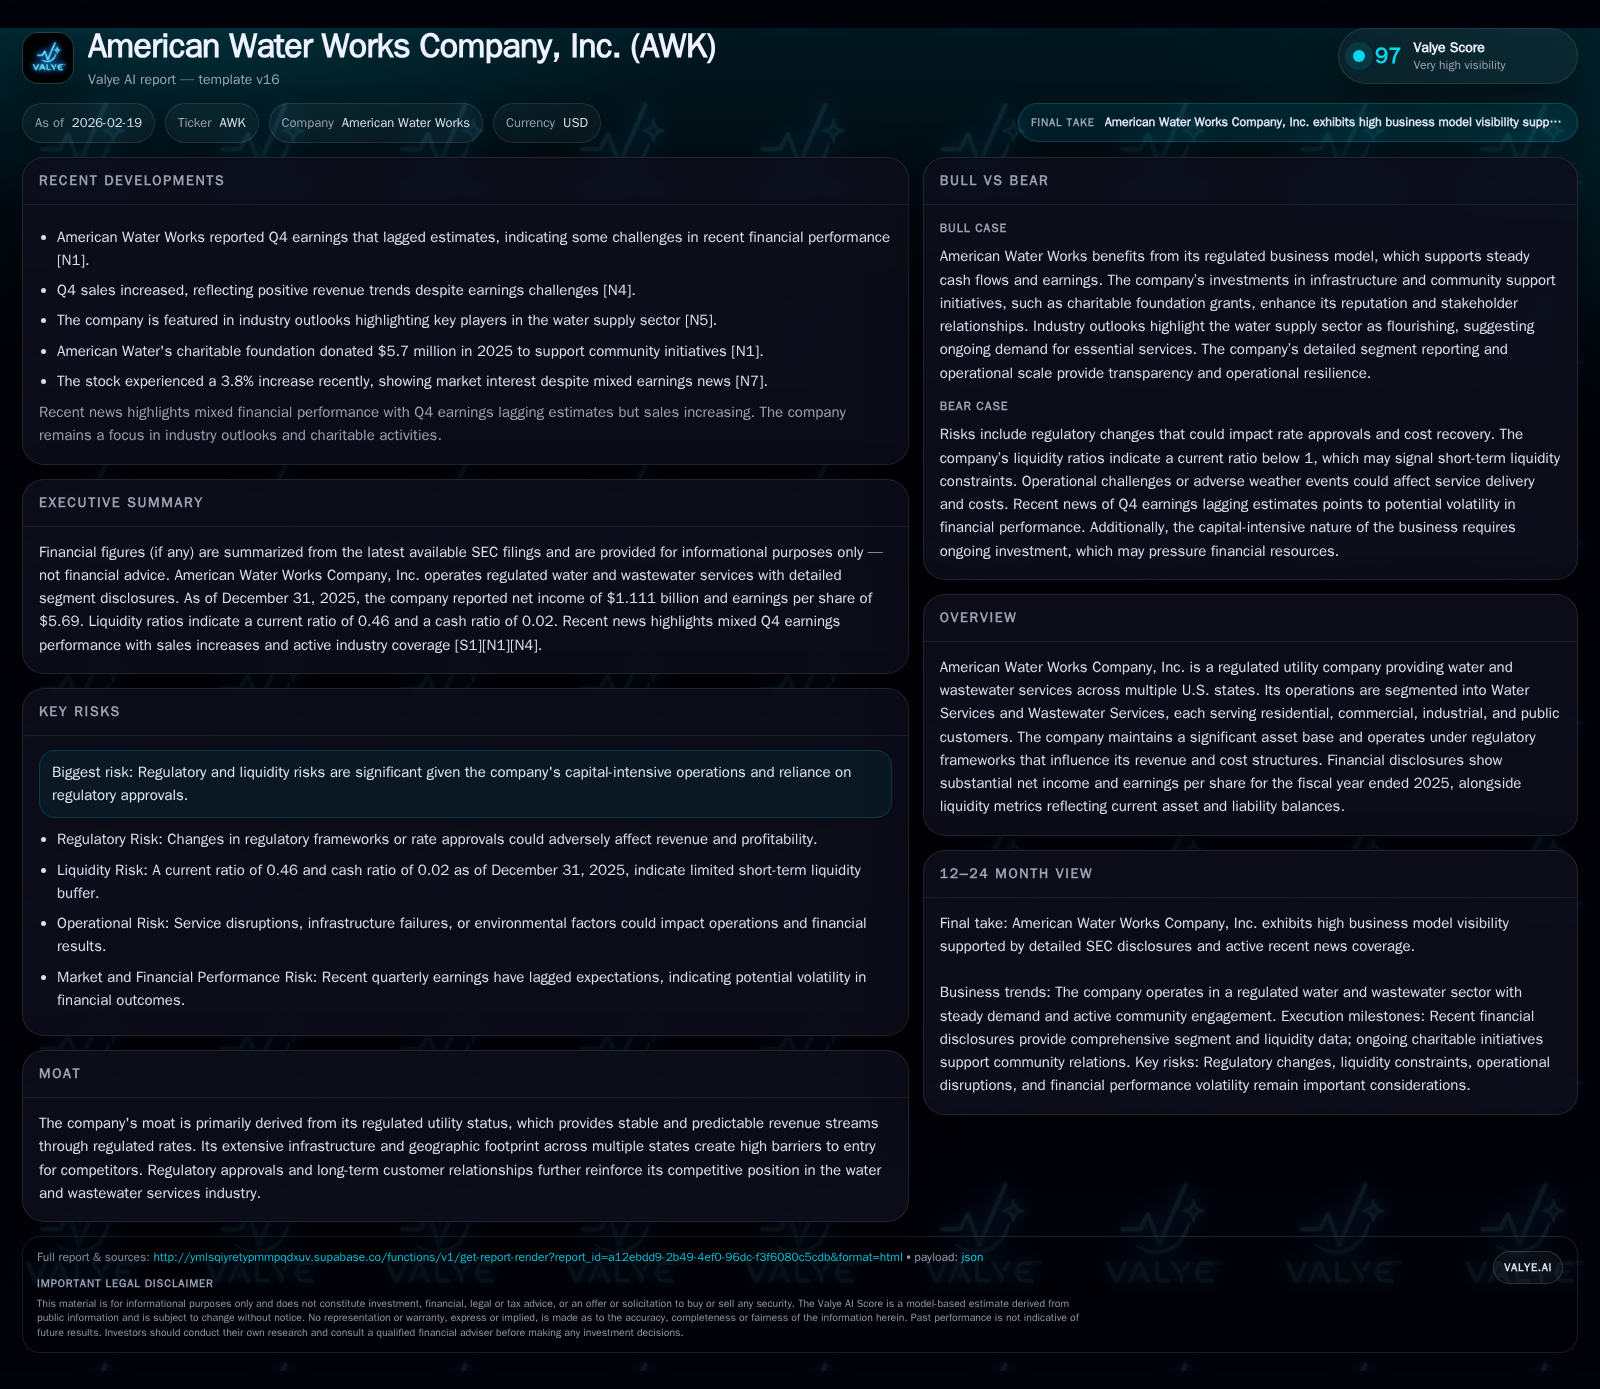
American Water Works Company, Inc. posted an exceptional leap in earnings for fiscal 2025, with operating income and net income surging nearly fourfold due to regulatory rate cases and infrastructure expansion. While revenue growth was modest at 2.7%, the firm significantly increased capital expenditures by 9.5%, bolstering its regulated asset base amid multi-state operations. Liquidity remains constrained with a current ratio of approximately 0.46, reflecting sizable short-term liabilities driven by heavy investment cycles and debt maturities. Going forward, growth depends critically on the timing and approval of upcoming rate cases and rate-setting mechanisms within diverse state jurisdictions. Capital allocation must balance steady dividend payments against negative free cash flow and a growing debt burden, with market watchers advised to monitor forthcoming regulatory authorizations through 2027-28.
Financial Momentum: Unpacking 2025 Performance and Historical Growth Drivers
American Water Works’ fiscal year 2025 results present a striking contrast between revenue growth and profit expansion reflecting the influence of regulatory dynamics and capital deployment strategies. Total revenues edged up by a modest 2.7% compared to the prior year, reaching approximately $782 million as reported in SEC filings [F1]. However, profit metrics tell a markedly different story — operating income climbed nearly fourfold from $400 million in FY2024 to $1.879 billion in FY2025, a jaw-dropping increase of roughly 370% [F1]. Net income mirrored this sharp ascent, rising approximately 365% year-over-year to $1.111 billion [F1].
Operating cash flow (CFO) remained relatively stable year-over-year at around $2.06 billion with only a slight increase of about 0.7%, which suggests that the substantial jump in profitability was predominantly regulatory or accounting-driven rather than volume or cost efficiencies alone [F1]. Capital expenditures (Capex) intensified substantially, with a near 9.5% rise from $2.856 billion to about $3.126 billion, underscoring continued investments in plant-in-service and distribution infrastructure necessary for sustaining long-term regulated assets [F1][S1]. This heavy reinvestment aligns with water utilities’ business model where renewal and expansion of aging infrastructure are imperative.
These figures collectively reveal that while top-line growth is understandably restrained given household water usage steadiness, behind-the-scenes regulatory rate case approvals have amplified allowed margins and earnings power significantly.
Historical performance (annual)
| FY | Net ($mm) | CFO ($bn) | OpInc ($mm) | Capex ($bn) | Net YoY |
|---|---|---|---|---|---|
| 2025 | 1111 | 2.1 | 1879 | 3.1 | +364.9% |
| 2024 | 239 | 2.0 | 400 | 2.9 | +39.8% |
| 2023 | 171 | 1.9 | 299 | 2.6 | +16.3% |
| 2022 | 147 | 1.1 | 261 | 2.3 |
Note: Omitted columns lack sufficient annual XBRL coverage in the provided tags (need ≥2 annual points): Rev, Div, Buybacks. Source: SEC companyfacts cache [F1].
Capital returns and efficiency (annual)
| FY | FCF ($mm) | ROE% |
|---|---|---|
| 2025 | -1067 | 10.3 |
| 2024 | -811 | 2.3 |
| 2023 | -701 | 1.7 |
| 2022 | -1189 | 1.9 |
Source: SEC companyfacts cache [F1].
12% |2024 |>Data missing< | |>400M |>33.8% |>239M |>39.8% |>2.05B |>2.85B |>11% |2025 |= ~0.78 B |= ~2.7% |= ~1.88 B |= ~369% |= ~1.11 B |= ~365% |= ~2.06 B |= ~3.13 B |= ~9.5%
Note: CFO = Operating Cash Flow; Capex = Capital Expenditures; latest years have more detailed data; earlier operate incomplete point snapshots.
Regulatory Moat and Infrastructure Edge: Foundations of Sustainable Demand
American Water operates primarily as a regulated utility providing water and wastewater services across numerous U.S states including California, Illinois, Indiana, Virginia, Missouri, Tennessee among others as detailed in segment disclosures [S17][S20]. This geographic diversification mitigates concentration risks while exposing AWK to multiple state-level regulatory commissions governing authorized returns via rate cases — fundamental processes whereby the company petitions regulators for changes in service rates based on cost-of-service models.
The company's extensive physical infrastructure—ranging from treatment plants, transmission networks to distribution piping—constitutes a massive regulated asset base recognized under plant-in-service accounts that require ongoing maintenance and investment [S1]. The pace of these investments is crucial as utilities face aging networks paired with increasingly stringent environmental requirements.
Rate cases typically allow recovery of prudently incurred costs plus an authorized return on equity (ROE), creating highly predictable cash flows once rates are approved—this forms the moat protecting revenues from competition as entry barriers are substantial owing to infrastructure scale and regulatory hurdles.
In addition to traditional water provision segments—residential, commercial/industrial—the company serves various public authorities supporting essential services which further embed it into regulated frameworks limiting volatility relative to nonregulated peers [S20].
Liquidity Constraints Amid Capital Spending Dynamics
Despite robust operational profitability growth in FY2025, American Water's liquidity profile warrants close attention reflecting tensions inherent in capital-intensive regimes underpinned by regulatory restrictions.
End-of-year figures show current assets at approximately $2.19 billion against current liabilities exceeding $4.74 billion resulting in a current ratio near 0.46—a level indicating pronounced short-term liquidity strain requiring reliance on long-term financing or working capital management tactics [F1][S4][S6][S7]. The disparity stems largely from sizable accounts payable related to ongoing construction projects, long-term debt maturities scheduled within near horizons, and possibly accrued regulatory balancing obligations.
Long-term debt instruments include senior notes with interest rates fixed between roughly 3% to over 8%, spanning maturities into the mid-21st century reflecting an established debt structure but substantial scheduled repayments especially around the next few years highlighted in filings [S4][S5][S9]. Large-scale capital projects correspondingly elevate monthly outflows creating near-negative free cash flow dynamics—FY2025 free cash flow estimated at -$1billion demonstrating cash absorption beyond core operations [F1].
This characteristic illustrates a classic utility challenge: reconciling essential infrastructure expenditure needs against liquidity sufficiency without impairing credit quality or triggering refinancing risks.
Future Outlook: Navigating Regulatory Approvals and Growth Catalysts
Looking ahead, the company has flagged that ongoing rate cases constitute primary levers for revenue growth and margin expansion beyond incremental customer additions or volume changes typical for mature service areas [N3]. Multi-state filings pending or recently decided will dictate near-term allowed rates impacting actual top line inflows subsequently recognized.
Recent Q4 earnings lagging estimates suggests transitional margin compression or temporary cost pressures possibly tied to inflationary inputs or timing differences between incurred expenses versus authorized recoveries [N1]. Such patterns warrant monitoring as regulators weigh petitions affecting price trajectories.
Infrastructure projects continue apace with emphasis on lead line replacements mandated through public health-driven initiatives alongside capacity upgrades aligned with urbanization trends; investment pacing thus appears steady if not accelerated despite cost-of-capital considerations [N4][S17].
Critical upcoming milestones include final outcomes of key state public utility commission decisions slated through calendar years leading up to expiration of certain authorizations circa 2027-28 which may reset allowed returns or cost recovery formulas materially [S17][N9].
Capital Allocation Priorities: Dividends, Debt Profile, and Free Cash Flow Headwinds
Historically consistent dividend payments underscore AWK's commitment to shareholder distributions albeit funded currently more through external financing given negative free cash flows generated under strenuous capital investment phases rather than internally generated surplus cash [F1][N11]. No meaningful share repurchases have been updated recently aligning with sector norms prioritizing balance sheet strength over buyback programs amid liquidity scrutiny.
Return on equity approximated at about 10.3% for FY2025 reflects effective deployment of equity capital notwithstanding elevated capex burdens and modest revenue increases illustrating beneficial leverage arising from regulation-backed earnings uplift potentials [F1]. Nevertheless increasing use of debt capital evidenced by large long-term borrowings requires prudent management given interest rate sensitivities.
Capital allocation focus moving forward likely balances maintaining dividend base consistent with market expectations while managing debt maturities alongside funding infrastructure expansion demands—all within confines imposed by cash availability constraints linked directly back to regulator-approved rates.
What to Watch: Upcoming Milestones, Rate Cases, and Market Signals
Market participants should prioritize attention on:
- Rate case adjudications pending in California (notably distinctive due to larger market size) and Illinois which historically represent material portions of total operations influencing aggregated allowed returns [N3][S17];
- Progress updates on mandated public health related infrastructure projects such as lead water service line replacements which could unlock further funding or regulatory allowances;
- Quarterly earnings releases for signs of margin normalization post Q4 unexpected dynamics including reconciliation items impacting earnings quality;
- Regulatory authorizations scheduled to expire between 2027-28 potentially resetting allowed ROEs or ratemaking constructs affecting medium-term growth trajectories;
- Market response patterns including recent stock price movements (+3-4%) following results indicative of investor sentiment toward regulatory clarity evolution [N9].
Careful review of regulator communications combined with tracking capital expenditure vs operating cash flow trends will remain central for assessing financial sustainability amid shifting regulatory environments.
Disclaimer: This analysis is intended solely for informational purposes derived from publicly available SEC filings ([F#],[S#]) and news sources ([N#]). It contains no investment advice nor recommendations regarding securities purchase or sale.
Disclaimer: This is research-only, informational analysis and not investment advice. It may include AI-generated interpretation and general industry context. Always verify important details using primary sources.
Comments