
Veralto Corp's Fiscal 2025 Surge and Its Strategic R&D Edge
Strong operating income growth at Veralto underscores its diversified model and focused innovation investments.
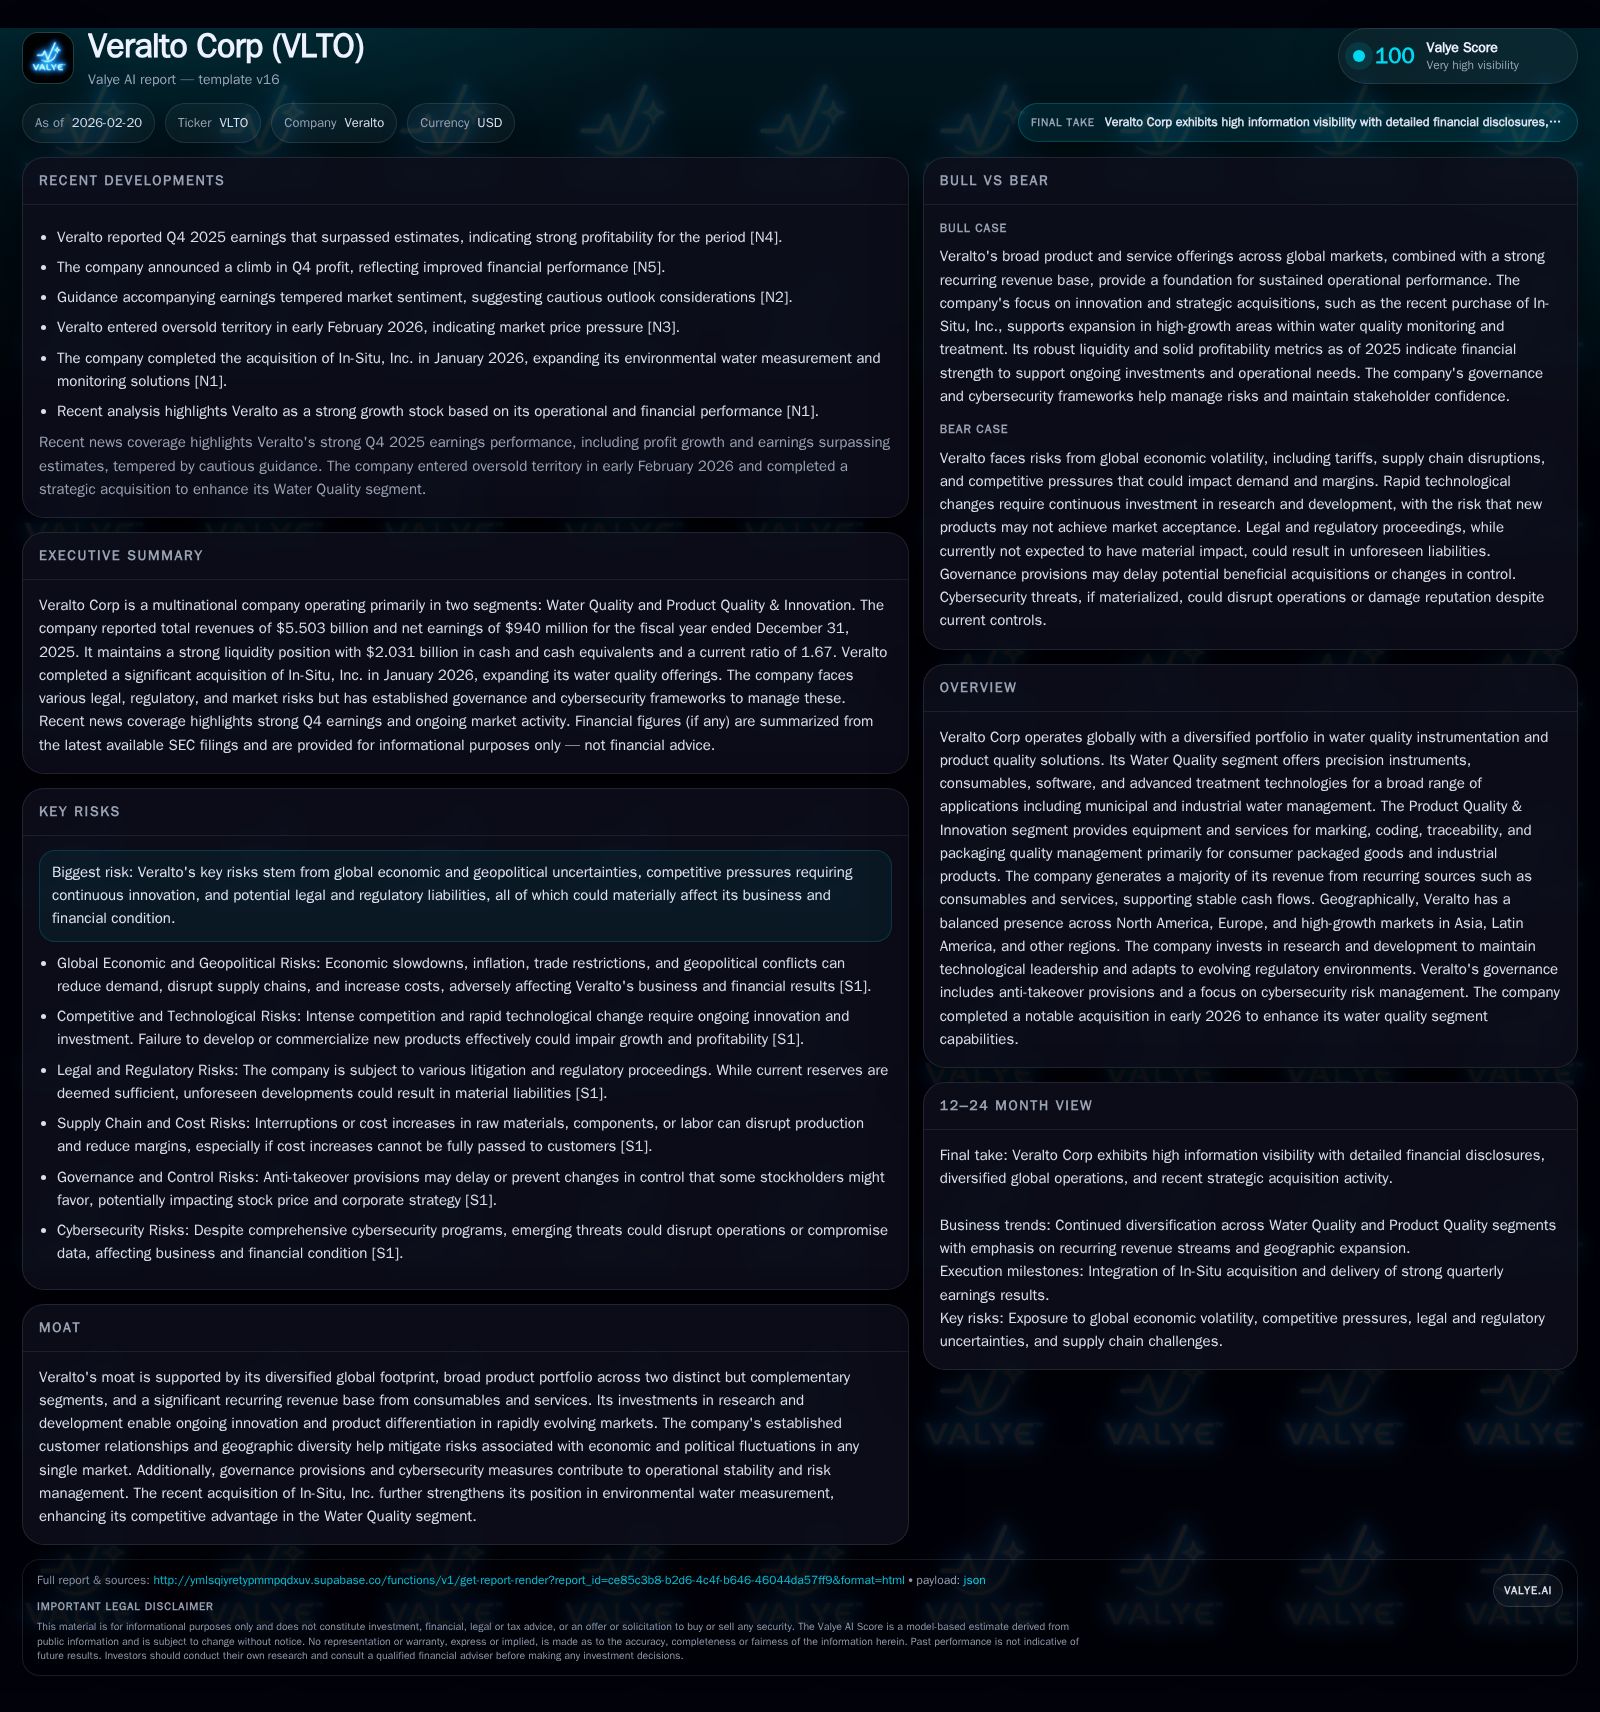
Veralto Corporation exhibited notable earnings expansion in fiscal 2025, driven largely by its recurring revenue base and global diversification across Water Quality and Product Quality segments. The recent acquisition of In-Situ, Inc. has bolstered its environmental water measurement capabilities, reinforcing its competitive moat. Despite macroeconomic headwinds, disciplined capital allocation, including measured capex and dividend increases, has supported sustained shareholder returns complemented by a 30% ROE. Legal and regulatory exposures remain ongoing risks but are currently well provisioned.
Veralto’s Earnings Trajectory: Growth Drivers Over Recent Years
Veralto Corp’s fiscal performance from 2023 through 2025 reflects a compounding momentum in earnings accompanied by cash flow strength despite ongoing macroeconomic headwinds. Operating income advanced from $1.14 billion in FY2023 to $1.28 billion in FY2025, exhibiting a compound annual growth rate that rests on a stable recurring revenue model along with operational efficiencies [F1]. Net income similarly accelerated, culminating in a notable 12.8% year-over-year jump to $940 million in FY2025 [F1]. Operating cash flow showcased resilience, increasing over 23% sequentially from FY2024 to FY2025 to $1.08 billion; this growth underscores effective working capital management amid global supply-chain complexity [F1]. Capital expenditures grew at a moderate pace of approximately 14.5%, reaching $63 million in FY2025, signifying consistent reinvestment across production facilities and R&D infrastructure [F1].
Historical performance (annual)
| FY | Net ($mm) | CFO ($mm) | OpInc ($mm) | Capex ($mm) | Net YoY |
|---|---|---|---|---|---|
| 2025 | 940 | 1077 | 1277 | 63 | +12.8% |
| 2024 | 833 | 875 | 1208 | 55 | -0.7% |
| 2023 | 839 | 963 | 1140 | 54 |
Note: Omitted columns lack sufficient annual XBRL coverage in the provided tags (need ≥2 annual points): Rev, Buybacks. Source: SEC companyfacts cache [F1].
Capital returns and efficiency (annual)
| FY | Div ($mm) | FCF ($mm) | ROE% |
|---|---|---|---|
| 2025 | 109 | 1014 | 30.3 |
| 2024 | 89 | 820 | 40.9 |
| 2023 | 909 | 60.7 |
Source: SEC companyfacts cache [F1].
Note: Buybacks data unavailable; revenue data not provided.
Quarterly earnings beats related to Q4 results signal positive momentum heading into the new fiscal year despite tempered forward guidance suggesting conservative assumptions on sales cycles [N2][N1].
Segment Synergies: Water Quality and Product Quality Contributions
Veralto’s two primary operating divisions—Water Quality and Product Quality & Innovation—create synergies that reduce business cyclicality and support stable install base expansion.
The Water Quality segment encompasses precision instrumentation paired with consumables, advanced treatment technologies, software analytics platforms, and services tailored for municipal and industrial water ecosystems globally [S22]. Its consumables run rate is bolstered by sustained deployment levels within long-term municipal contracts as well as industrial client adoption.
Product Quality & Innovation focuses on equipment for marking, coding, traceability solutions, and packaging quality assurance primarily utilized by consumer packaged goods producers and industrial manufacturers [S22]. The segment benefits from recurring component sales where hardware installed at customer sites induces steady consumable purchases.
Together these segments leverage cross-selling opportunities—for example, integrating environmental sensing data into quality control workflows enhances value propositions for key clients [N4]. This intersegment collaboration underpins durable revenue diversification that cushions against demand shocks specific to single industries or geographies.
Impact of In-Situ Acquisition on Market Positioning
The strategic acquisition of In-Situ, Inc., completed recently before fiscal year-end, enhanced Veralto’s footprint in the environmental water measurement arena—a niche characterized by highly specialized sensors tailored to rigorous field conditions [S1][N4].
This transaction provides scale advantages within the environmental sensor OEM landscape while expanding product offerings with complementary technology stacks embedded into the Water Quality segment portfolio.
Cross-segment integration allows leveraging of shared R&D resources to innovate sensor networks that feed software analytics platforms with real-time operational data streams—a capability increasingly requested by regulatory agencies and industrial end-users prioritizing compliance monitoring [N4].
Recurring Revenues: The Backbone of Stable Cash Flow
A defining feature of Veralto’s business model is its reliance on recurring revenues derived predominantly from consumables sales and contracted service arrangements [S1][F1]. This subscription-like stream establishes predictable cash flow underpinning less volatile financial outcomes amid global economic uncertainties.
Instruments installed within client operations create an ongoing demand for replacement parts, reagents, software updates, and analytical services that reinforce customer lock-in effects—key drivers supporting both top-line stability and margin resilience.
This contrasts with cyclical capital equipment sales alone by providing durable economic value less sensitive to one-off purchasing decisions or short-term capital expenditure deferrals.
R&D Investment as a Competitive Advantage
Capital deployment toward research and development remains prioritized alongside physical asset investments with a tilt favoring innovation-led differentiation [S29][F1]. The company increased overall capex allocations synergistically aligned with higher R&D outlays enabling sustained leadership in precision instrumentation design.
This balanced spend pattern allows incorporation of cutting-edge technologies such as advanced sensor materials, embedded AI-enabled diagnostics, and connected cloud functionalities integrated within product suites.
Consequently, Veralto maintains high barriers to entry against competitors whose product roadmaps may lag owing to weaker R&D funding or narrower technology scopes.
Geographic Footprint and Mitigating Regional Risks
Veralto operates across approximately fifty countries via sixty principal facilities including manufacturing hubs, sales offices, distribution centers, and R&D labs primarily sited across North America (21 facilities across twelve states), Europe (majority of non-U.S.), Latin America, Asia-Pacific regions including high-growth markets like India and China [S17].
Such wide geographic dispersion dilutes risk concentration tied to local economic downturns or political instability while facilitating closer proximity to diverse customer bases in developed versus emerging markets – the latter accounting for roughly one-third of revenues per management commentary [S17].
Currency exposure mitigation is addressed through derivative hedging programs including cross-currency swaps targeting euro/Swiss franc exchange fluctuations linked to non-U.S operations [S16]. Supply chain flexibility measures also help the company navigate inflationary pressures impacting raw material costs.
Capital Allocation: Dividends, Capex, and Return on Equity Insights
Veralto demonstrates disciplined capital stewardship balancing organic growth investments with returning cash to shareholders.
Net stockholders’ equity expanded markedly from $1.38 billion in FY2023 to $3.11 billion at FY2025-end signaling retained earnings accumulation alongside new equity issuance or capital structure optimization initiatives [F1]. Coupled with reported net income of $940 million for FY2025 yields an approximate ROE near 30%, which is a robust metric indicative of efficient capital use within its industry context [F1].
Dividends paid grew from $89 million per annum during FY2023-24 to $109 million in FY2025 reflecting progressive dividend policy adjustments – specifically a Q4 increase from $0.11 to $0.13 per share consistent with management's commitment to regular distributions when cash flow permits [S9][F1][N1].
Notably though no share repurchases occurred during the most recent full year under review despite board authorization for up to $750 million stock buybacks announced late in calendar year 2025 – this likely reflects cautious liquidity management amid strategic post-acquisition integration phases [S18][N1].
Free cash flow generation remains solid given the difference between operating cash flow at $1.08 billion versus capex at mid-$60 million range yielding ample room for re-investments plus shareholder payouts [F1][S29].
Navigating Legal and Regulatory Exposures
Veralto faces multifaceted legal risks consistent with companies operating globally across regulated product domains including intellectual property disputes, commercial claims, employment litigation, tax matters, competitive practices challenges as well as environmental liabilities tied both to current operations and legacy waste disposal practices [S4][S5][S6][S15].
The company maintains insurance coverage spanning general liability through directors’ & officers’ liability policies but acknowledges potential gaps exist which require establishing reserves assessed periodically through external legal counsel input according to evolving case developments [S12][S13][S15].
Environmental compliance imposes ongoing cost burdens but current regulatory frameworks have not led management to anticipate material capital expenditures or penalties beyond routine remediation activities so far [S25][S26]. Nevertheless continuous monitoring is warranted given changing laws internationally may impose higher compliance standards or retroactive obligations impacting financials.
The aggregate recorded warranty liabilities remained stable at approximately $30 million over recent years evidencing conservative provisioning aligned with historical failure rates [S11]. Purchase obligations stood near $166 million due primarily within one year reflecting contractual commitments embedded across operations ensuring supply continuity [S7].
What to Watch: Future Earnings Guidance and Market Indicators
While Veralto reported impressive fiscal results for calendar year-end December 2025 releases showed tempered guidance tone emphasizing caution amidst uncertain macroeconomic environments including delayed capital projects among customers,[N1] forward-looking signals focus on indicators such as quarterly sales cadence trends particularly backlog changes offering insights into demand sustainability.[N3]
Investors should monitor integration progress of In-Situ acquisition including realization of expected synergies impacting margin profiles.[N4] Additionally pipeline developments around next-generation instrumentation technologies funded through R&D spend represent catalysts influencing medium-term organic growth trajectories.[N3]
Risks related to geopolitical shifts especially trade policies affecting cross-border supply chains will warrant ongoing scrutiny alongside any shifts in currency hedging strategies disclosed in filings.[S20]
Overall market sentiment will likely remain calibrated until fresh visibility emerges regarding global municipal investment trends impacting core water infrastructure projects important for dependable consumables consumption volumes.
Disclaimer: This analysis is based solely on publicly available information as of February 20, 2026 including SEC filings and market reports referenced herein; it does not constitute investment advice nor an endorsement of any securities mentioned.
Disclaimer: This is research-only, informational analysis and not investment advice. It may include AI-generated interpretation and general industry context. Always verify important details using primary sources.
Comments