
Brookfield Asset Management’s Expansion of Fee-Bearing Capital and Cash Flow Growth
Brookfield’s diversified asset management platform has driven exceptional growth in net income and cash flow, underpinned by strategic capital deployment and strong liquidity.
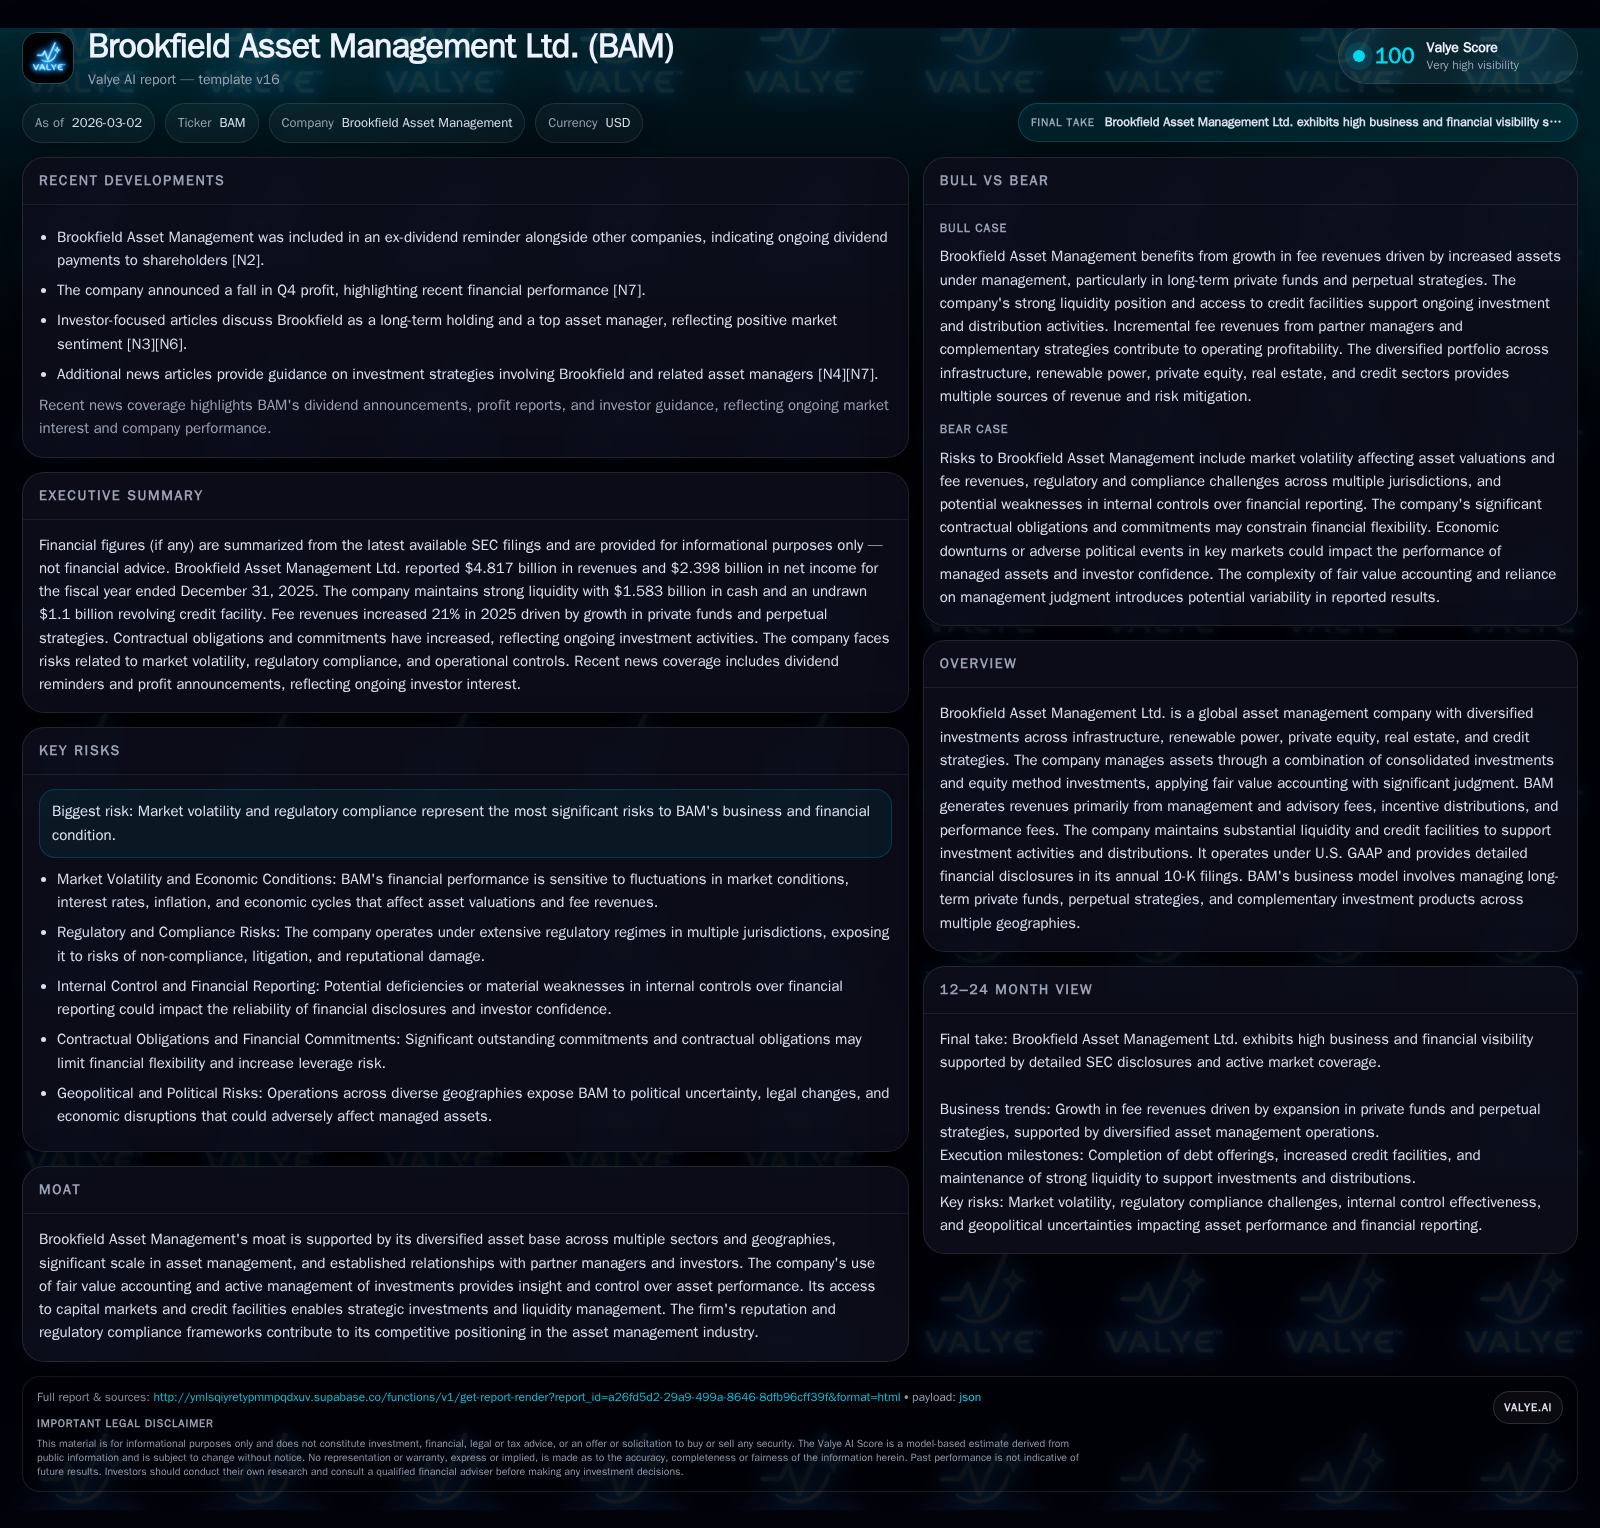
Brookfield Asset Management Ltd. (BAM) has experienced a remarkable recovery in earnings, with net income soaring over 340% year-on-year to $2.4 billion in FY2025, supported by expanding fee revenues from increased fee-bearing capital. The firm maintains a solid liquidity position with $3 billion in corporate deployable capital and prudent use of revolving credit facilities and bond issuances, enabling continued investment activity and distribution sustainability. BAM's fee-bearing capital rose 12% to $603 billion, demonstrating successful fundraising across infrastructure, renewables, private equity, real estate, and credit strategies. While the company targets a roughly 90% payout ratio of distributable earnings to shareholders, it also balances reinvestment for future growth. Key risks include market volatility impacting asset valuations and regulatory complexities in multiple jurisdictions. Future growth will depend on deployment of sizable uncalled commitments and performance of new fund launches.
Strong Earnings Recovery and Expanding Fee Revenues: Historical Overview
Brookfield Asset Management Ltd. (BAM) demonstrated a remarkable turnaround in its financial results through FY2025, posting a net income of approximately $2.4 billion compared to just $541 million in FY2024, marking a striking 343% increase year-over-year [F1]. This surge was accompanied by operating cash flow increasing from $627 million to over $2.1 billion—a gain exceeding 235%—which underscores significant improvement in BAM's cash generation capabilities alongside its profitability rebound [F1].
This uplift aligns closely with growth in BAM's fee revenues—a critical metric reflecting recurring cash flows derived from base management fees, advisory services, incentive distributions, performance fees, and transaction fees but explicitly excluding carried interest and consolidated fund revenues as per company non-GAAP definitions [S1]. The strength in these fees results from an enlarged asset base under management coupled with higher levels of fee-bearing capital commitments.
These results mirror BAM's disciplined approach separating recurring Fee Revenues from more volatile carried interest components. The company monitors Fee-Related Earnings as an operating profitability barometer that strips away consolidation effects and focuses solely on fees less direct costs including compensation and professional services [S1]. Fee-Related Earnings climbed substantially as operational scale leveraged tighter cost controls.
Historical performance (annual)
| FY | Net ($bn) | CFO ($bn) | Net YoY |
|---|---|---|---|
| 2025 | 2.4 | 2.1 | +343.3% |
| 2024 | 0.5 | 0.6 | +20.0% |
| 2023 | 0.5 | 0.5 | +2273.7% |
| 2022 | 0.0 | -0.0 |
Source: SEC companyfacts cache [F1].
Capital returns and efficiency (annual)
| FY | Div ($bn) | Buybacks ($mm) | ROE% |
|---|---|---|---|
| 2025 | 2.8 | ||
| 2024 | 0.6 | 16.7 | |
| 2023 | 0.5 | 319 | 21.7 |
| 2022 | 330 | 0.8 |
Source: SEC companyfacts cache [F1].
Table: Brookfield Historical Financial Performance Summary - FY2022 to FY2025 [F1]
Capital Structure and Liquidity: Foundation for Growth
BAM's liquidity profile forms a critical pillar supporting its expansive asset deployment strategy and shareholder returns framework. As of December 31, 2025, BAM reported corporate liquidity of roughly $3 billion composed of $1.6 billion in cash and short-term financial assets readily convertible to cash within twelve months plus undrawn revolving credit facilities amounting to about $1.4 billion [S4][S5].
This cushion is complemented by recent bond issuances aggregating several billion dollars across maturities from five to thirty years with coupon rates ranging from approximately 4.65% to over 6%, underscoring BAM's access to long-dated fixed-rate debt supportive of its durable funding needs [S4].
Revolving credit facilities include a prominently sized U.S./Canadian dollar facility originally sized at $750 million in August 2024 and upsized to $1.1 billion in September 2025 without any outstanding draws at year end; pricing terms employ benchmark rates such as SOFR or CORRA plus margins near 110 basis points—typical of investment-grade bilateral lending arrangements [S4][S5].
The company also assumes customary operating covenants limiting leverage relative to distributable earnings among other restrictions—standard protections that ensure balance sheet flexibility but impose constraints on additional indebtedness with consequences for refinancing or strategic acquisitions if breached [S6][S7].
Diversified Assets Under Management and Fee-Bearing Capital Dynamics
Brookfield defines Assets Under Management (AUM) using a sophisticated methodology incorporating both consolidated investments—where BAM controls day-to-day operations—and equity method investments where significant influence exists but consolidation does not occur [S1]. Notably, BAM values these on a gross asset value basis including both equity and debt components; perpetual funds' investments are proportioned economically based on NAV share.
Fee-Bearing Capital represents the committed capital qualifying BAM for recurring management fees across perpetual affiliates, private funds, and liquid strategies encompassing both invested (called) and uncalled portions [S18]. A substantial factor driving revenue scaling is the inflow component representing new capital commitments along with periodic contributions or issuances.
As at December 31, 2025, fee-bearing capital stood at approximately $603 billion—up by nearly $64 billion or roughly 12% year-over-year—with inflows totaling about $90.8 billion broadly distributed as follows: credit strategies driving around $53 billion mainly through insurance-backed sources; real estate contributing over $16 billion; renewable power & transition attracting about $10.4 billion; infrastructure adding close to $6 billion; and private equity raising approximately $5.3 billion [S14].
Crucially, about $63 billion of uncalled commitments at year-end are currently not generating fees but poised to become fee-bearing upon deployment—a central pipeline for future recurring revenue growth [S14][S18]. This pipeline is diversified across sectors including considerable amounts committed beyond the immediate investment periods.
Distribution Policy, Returns on Equity, and Shareholder Value Creation
BAM targets distributing roughly 90% of its Distributable Earnings back to shareholders on a quarterly basis while retaining some capital for reinvestment into growth initiatives—balancing yield with sustainable business expansion [S1][S24]. Distributable Earnings aggregate Fee-Related Earnings plus realized performance allocations accrued from carried interest events along with corporate investment returns after tax expenses.
Looking at returns on equity (ROE), BAM generated near a 74% figure for FY2025 calculated using net income against average equity balances—highlighting an extraordinarily high return profile typical for asset managers leveraging fee-based business models combined with performance fees from investment gains [F1].
Dividend payments have scaled commensurately with earnings growth—from around half a billion dollars paid in FY2023 rising sharply past $2.8 billion by FY2025—signaling robust cash availability despite ongoing reinvestments [F1][S24]. Meanwhile buyback activities were modestly active during earlier years but absent in the latest period as capital was preferentially allocated towards distributions.
Overall shareholder value creation appears well-aligned with operating cash flow trends that paralleled increasing net income.
Risks from Market Volatility and Regulatory Environment
The company's business remains vulnerable to market price volatility which can affect fair value assessments central to BAM’s revenue recognition—particularly for performance-related fees whose realization depends on asset appreciation under fair value accounting frameworks requiring considerable judgment [S11][S20]. Fluctuations can introduce earnings volatility not fully captured within current periods.
Regulatory compliance represents another predominant risk domain; BAM operates under complex multi-jurisdictional regimes involving U.S., Canadian, European Union, U.K., Latin American, Australian, Indian, South Korean authorities among others—each imposing extensive investor protection laws, registration mandates, anti-corruption rules and environmental regulations that could materially raise compliance costs or trigger enforcement actions impacting reputation or operational flexibility [S12][S22][S23].
Internal control weaknesses are recognized potential risks particularly related to integrating acquired businesses or managing extensive subsidiary structures leading to possible misstatements in public financial reporting without timely detection—a reputational hazard for any large asset manager amid heightened regulatory scrutiny [S11].
Litigation exposure including environmental claims or regulatory investigations adds further uncertainty concerning material adverse effects on financial condition or reputation should adverse outcomes materialize [S25].
Future Growth Drivers: Investment Opportunities and Capital Deployment
Looking ahead, core growth catalysts hinge on deploying significant uncalled fund commitments approaching $111 billion at end-2025 which holds substantial revenue upside once invested due to the associated increases in base management fees alongside transaction-driven advisory fees [N14][S14][N8].
New fund launches—including flagship global transition funds focused on renewables—and expansions into complementary strategies remain key avenues for expanding fee-bearing capital base consistent with strategy diversification outlined by leadership as well as investor appetite for decarbonization aligned portfolios [N8][N14].
Strategic liquidity reserves allow BAM flexibility to capitalize rapidly on acquisition opportunities or seed next-generation strategies without sacrificing distribution consistency—a critical competitive advantage given asset managers’ race for scale amid evolving market dynamics.
Outlook and What to Watch: Fee-Related Earnings and Fund Commitments
Without explicit forward guidance disclosed publicly within filings or press releases beyond year-end results, the prudent monitoring focus resides on metrics such as sequential quarterly changes in fee-related earnings—highlighting underlying organic growth potential divorced from timing differences inherent within carried interest realization—and progress toward calling down uncalled commitments signaling capital deployment velocity trends relevant for revenue momentum going forward [N8][S1].
Additionally, tracking announcements surrounding new fund closures or vintage launches provides useful early indicators of success in attracting third-party investors critical for sustaining long-term revenue streams within Brookfield’s diversified product suite.
These indicators collectively should offer meaningful insight into whether Brookfield sustains its strong growth trajectory established through recent fiscal years while balancing risk exposures intrinsic to operating at scale across complex global markets.
This analysis relies exclusively on verified company disclosures from BAM's filed SEC reports as of March 2, 2026 ([F1], [S#]) complemented by factual news references ([N#]) without speculative forecasts or investment recommendations.
Disclaimer: This is research-only, informational analysis and not investment advice. It may include AI-generated interpretation and general industry context. Always verify important details using primary sources.

Comments