
Nine Energy Service’s Financial Turmoil Casts Shadow on Oilfield Innovation
Despite steady revenues supported by specialized completion technology, Nine Energy Service grapples with deep profitability losses and restructuring under Chapter 11.
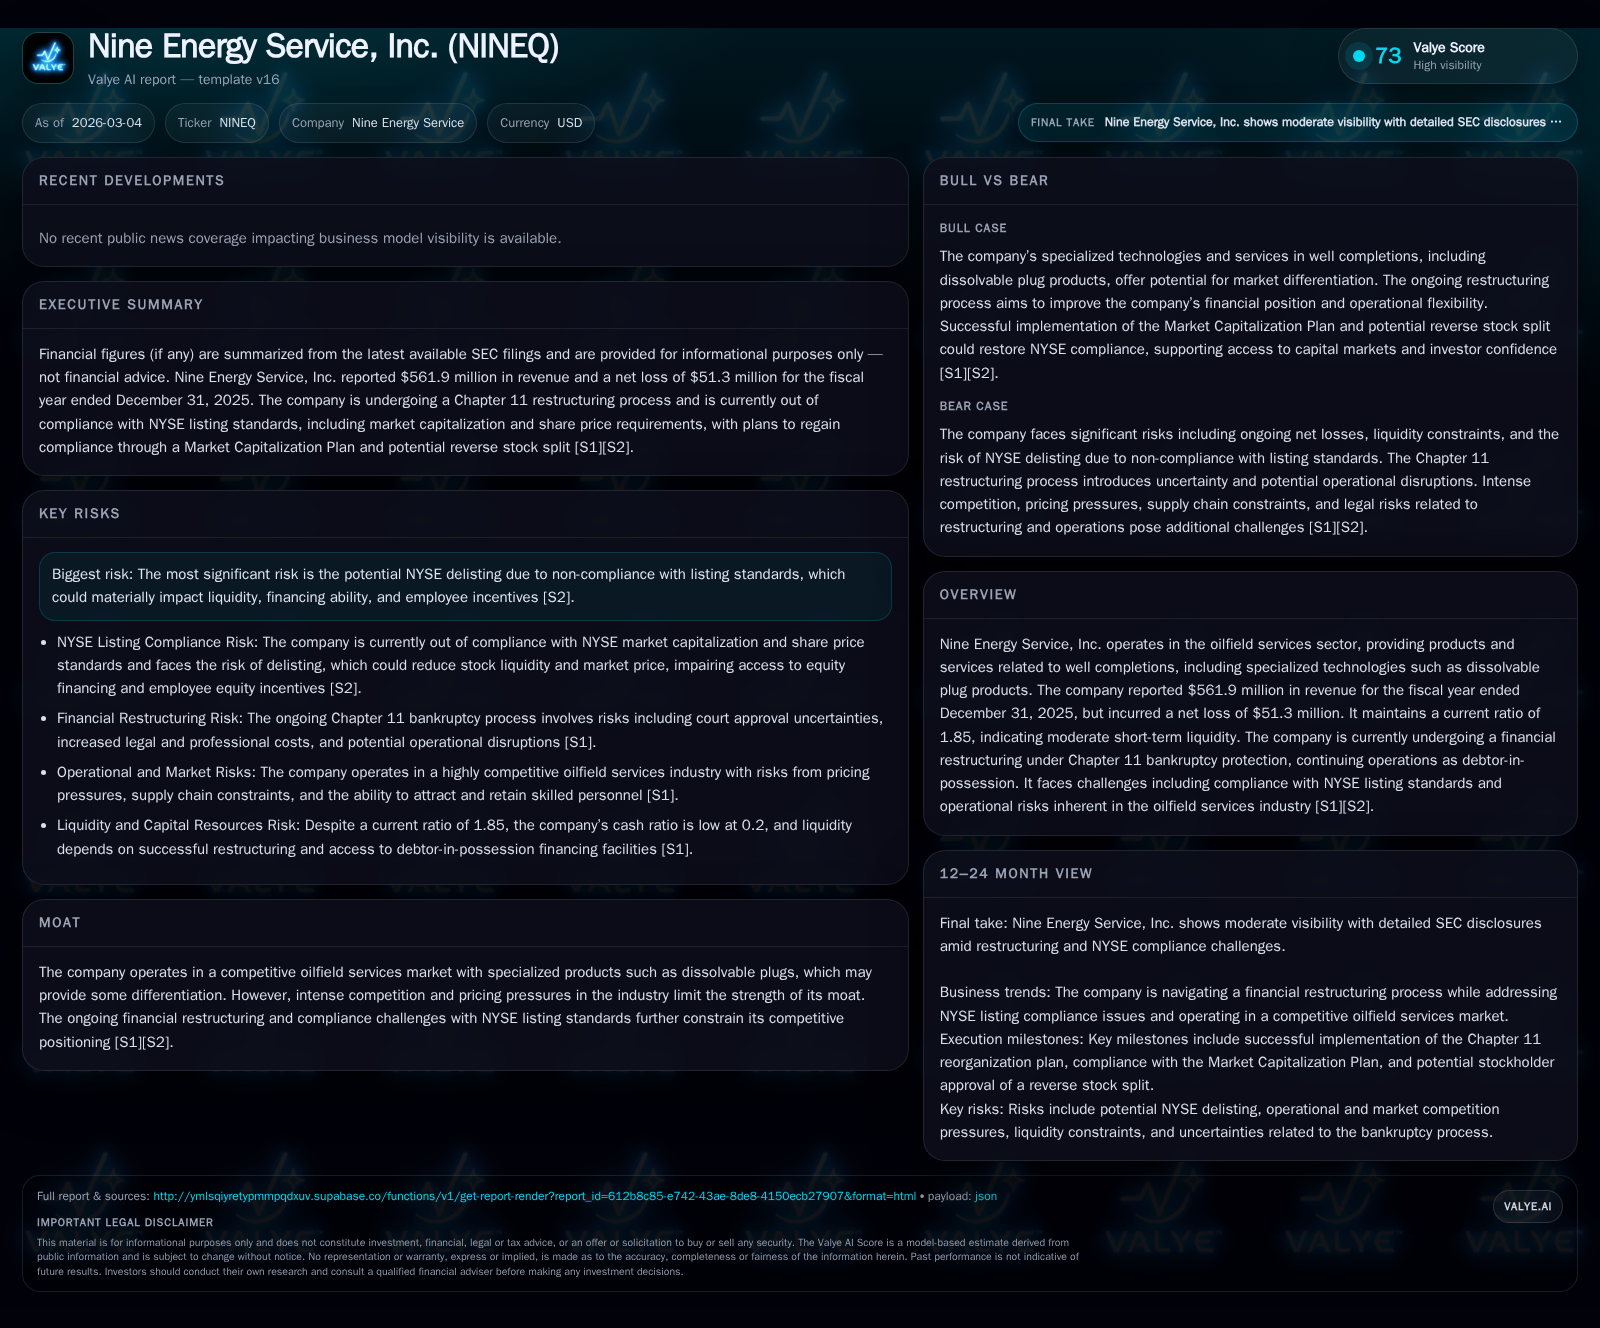
Nine Energy Service has maintained relatively stable revenues amid sector headwinds, driven in part by its niche dissolvable plug products. However, profitability has sharply deteriorated, culminating in a net loss exceeding USD 51 million in 2025. The company operates under Chapter 11 bankruptcy protection, navigating liquidity constraints and NYSE delisting risks. Refinancing efforts include a debtor-in-possession asset-based revolving credit facility designed to sustain operations during restructuring. Near-term recovery hinges on successful plan confirmation and compliance with listing requirements — key milestones that will shape the company's ability to rebuild competitive positioning in oilfield services.
Nine Energy Service operates at a paradoxical crossroads — pioneering specialized dissolvable plug technologies within the oilfield services sector while simultaneously wrestling with severe financial distress that culminated in a Chapter 11 filing in early 2026. This dynamic paints a stark contrast between operational innovation and capital structure challenges that have reshaped its near-term trajectory.
Revenue Trends and Operational Drivers: Historical Performance Overview
From FY2022 through FY2025, Nine Energy Service's revenue profile exhibited relative stability with only modest fluctuations amidst the cyclical pressures typical of oilfield services [F1]. Revenues recorded USD 593.4 million in FY2022 before peaking at USD 609.5 million in FY2023 — a year marked by certain sector rebounds. However, cautious capital spending across the broad U.S. onshore upstream sector led to constrained activity levels impacting oilfield service volumes globally.
In response, revenue slightly contracted in FY2024 to USD 554.1 million before rebounding modestly to USD 561.9 million in FY2025 [F1]. This revenue resilience can be partly attributed to the company's niche product line of dissolvable plug technology for well completions, which serves as a differentiated offering amid commodity-like service pressures [S1][S7]. Still, widespread industry capital discipline and supply chain constraints likely capped potential expansion.
Historical performance (annual)
| FY | Rev ($mm) | Net ($mm) | CFO ($mm) | OpInc ($mm) | Rev YoY | Net YoY |
|---|---|---|---|---|---|---|
| 2025 | 562 | -51 | -7 | 2 | +1.4% | -24.9% |
| 2024 | 554 | -41 | 13 | 9 | -9.1% | -27.5% |
| 2023 | 610 | -32 | 46 | 18 | +2.7% | -323.8% |
| 2022 | 593 | 14 | 17 | 44 |
Source: SEC companyfacts cache [F1].
Capital returns and efficiency (annual)
| FY | FCF ($mm) | ROE% |
|---|---|---|
| 2025 | -23 | 44.6 |
| 2024 | -2 | 62.2 |
| 2023 | 21 | 90.4 |
| 2022 | -12 | -61.2 |
Source: SEC companyfacts cache [F1].
Earnings Decline: The Shift in Profitability Dynamics
While revenues showed modulated resilience, operating income traced an alarming decline from USD 43.6 million in FY2022 down to just USD 2.3 million by FY2025 — representing more than a seventy percent collapse year-over-year [F1]. This erosion translated into persistent net losses expanding from a profit position of USD +14.4 million in FY2022 into loss territory exceeding USD -51.3 million by FY2025.
Year-over-year operating income contracted by approximately 74%, indicative of margin compression driven by intensified pricing pressures, higher costs per job from fixed overhead absorption on lower activity volumes, and possibly escalating input inflation [F1]. The oilfield services industry frequently struggles with inflexible cost structures that weigh heavily on profitability when demand softens or competition intensifies.
Simultaneously, operating cash flows turned sharply negative at approximately USD -7.3 million in FY2025 after positive inflows of over USD +45 million three years prior [F1]. This deterioration reflects the growing gap between cash-generative activities and underlying earnings performance as working capital management tightened under stress.
| Fiscal Year | Operating Income (USD million) | YoY Operating Income % | Net Income (USD million) | YoY Net Income % |
|---|---|---|---|---|
| FY2022 | 43.6 | +14.4 | ||
| FY2023 | 17.6 | -59.7% | -32.2 | |
| FY2024 | 8.9 | -49.4% | -41.1 | |
| FY2025 | 2.3 | -73.7% | -51.3 | -24.9% |
Liquidity Crunch and NYSE Compliance Challenges
Liquidity strains surfaced acutely alongside sustained losses and equity erosion [F1]. Nine Energy Service's current ratio stood at a moderate but fragile level of approximately 1.85 as of year-end 2025 with current assets of USD168.8 million vs liabilities of USD91.4 million [F1]. Despite this buffer, investor confidence eroded significantly due to persistent market capitalization below NYSE thresholds and average trading prices falling beneath the mandated $1 minimum.
The company received formal notifications from NYSE warning of likely delisting due to these continued listing standard violations [S2][S11]. The exchange evaluated corrective plans including a proposed reverse stock split contingent upon shareholder approval in the upcoming annual meeting — a necessary but uncertain step toward regaining compliance [S2][S22]. Consequences of delisting include reduced liquidity for shareholders, diminished ability to raise equity financing on reasonable terms, and constraints on employee equity incentive programs.
Chapter 11 Filing and Bankruptcy Navigation
Faced with mounting financial pressure, Nine Energy Service initiated voluntary Chapter 11 proceedings on February 1, 2026 under a pre-packaged reorganization plan [S12][S19]. Debtor-in-possession (DIP) financing through a senior secured super-priority asset-based revolving credit facility was established providing up to USD125 million for working capital purposes during restructuring [S6][S8][S12].
This DIP ABL facility structurally refinanced prepetition loans granting liquidity continuity while binding stakeholders’ cooperation per the Restructuring Support Agreement [S14][S16][S17]. The borrowing base calculation incorporates eligible accounts receivable from U.S., Canadian and international operations plus inventory values subject to customary advance rates — ensuring disciplined collateral coverage [S6][S12]. Interest rates are pegged to SOFR plus margins with minimum floors consistent with distressed lending markets [S9].
Outlook: Recovery Prospects and Market Position Constraints
Nine Energy Service’s forward prospects hinge critically on successful confirmation of the restructuring plan and execution of the exit financing facility converting DIP commitments into permanent capital arrangements [S12][S23]. Given that the company faces steep competition amid a commoditized backdrop for many oilfield services except for isolated niches like dissolvable plugs, re-establishing stable growth will be challenging without operational efficiencies or market share gains [S1][S2].
Risks remain pronounced given uncertainties related to macroeconomic conditions influencing upstream capex levels globally — including geopolitical instability affecting oil supply dynamics — as well as pricing pressures inherent in concentrated segments where several competitors vie aggressively [S18].
Capital Structure, Debt Reorganization, and Credit Facilities
Bankruptcy automatically accelerated all senior debt obligations rendering previously scheduled repayments immediately due; enforcement stays now temporarily shielded the company under court supervision [S10][S16]. Post-plan effective date provisions envisage cancellation of existing common stock with issuance concentrated among senior secured note holders converting claims into equity stakes [S17].
The transition from prepetition debt to DIP financing follows typical "roll-up" structures seen frequently within energy sector restructurings where asset-based revolvers underpin working capital needs while restraining dividend distribution through covenant overlays [S12][S16]. Restrictions also inhibit new acquisition spending or material investments absent further creditor approval thereby tightening strategic flexibility.
Free Cash Flow Pressures and Capital Allocation Decisions
Free cash flow generation remains deeply negative estimated at roughly USD -23 million between operating cash outflows of close to USD -7.3 million combined with ongoing capex demands upwards of nearly USD16 million annually oriented toward maintaining essential operational capacity rather than expansion [F1]. This cash burn substantially restricts any possibility for shareholder returns such as dividends or buybacks which are completely absent given precarious liquidity conditions.
Return metrics like ROE reflect impairments consistent with net losses against negative equity positions approaching minus USD115 million reflecting accumulated deficits exacerbated post-bankruptcy declaration [F1].
| Fiscal Year | Operating Cash Flow (USD million) | YoY CFO % | Capex (USD million) |
|---|---|---|---|
| FY2022 | +16.7 | 28.6 | |
| FY2023 | +45.5 | 24 | |
| FY2024 | +13.2 | 14.8 | |
| FY2025 | -7.3 | -155 | 15.9 |
What to Watch: Key Milestones in Restructuring and Market Reentry
Looking ahead, critical near-term milestones for Nine Energy Service revolve around the timing of Plan Effective Date anticipated by March–April 2026 ensuring DIP-to-exit facility conversion; shareholder voting outcomes on proposed reverse stock split at the forthcoming Annual Meeting referenced in SEC filings; ongoing quarterly reviews by NYSE assessing Market Capitalization Plan adherence; and potential SEC approvals surrounding delisting proceedings following Form 25 submission by NYSE [S2][S20][S23].
Failure to achieve these junctures would compromise access to capital markets severely while successful navigation may enable stabilization permitting long-term operational turnaround strategies post-bankruptcy emergence.
This report compiles factual information about Nine Energy Service based exclusively on publicly available SEC filings without offering investment recommendations or price forecasts.
Disclaimer: This is research-only, informational analysis and not investment advice. It may include AI-generated interpretation and general industry context. Always verify important details using primary sources.
Comments