
TriplePoint Venture Growth BDC Corp. Balances Portfolio Growth with Capital Structure Optimization in 2025
TPVG reported a net income rebound and expanded portfolio but faced operating cash flow challenges and managed capital through debt maturities and new notes.
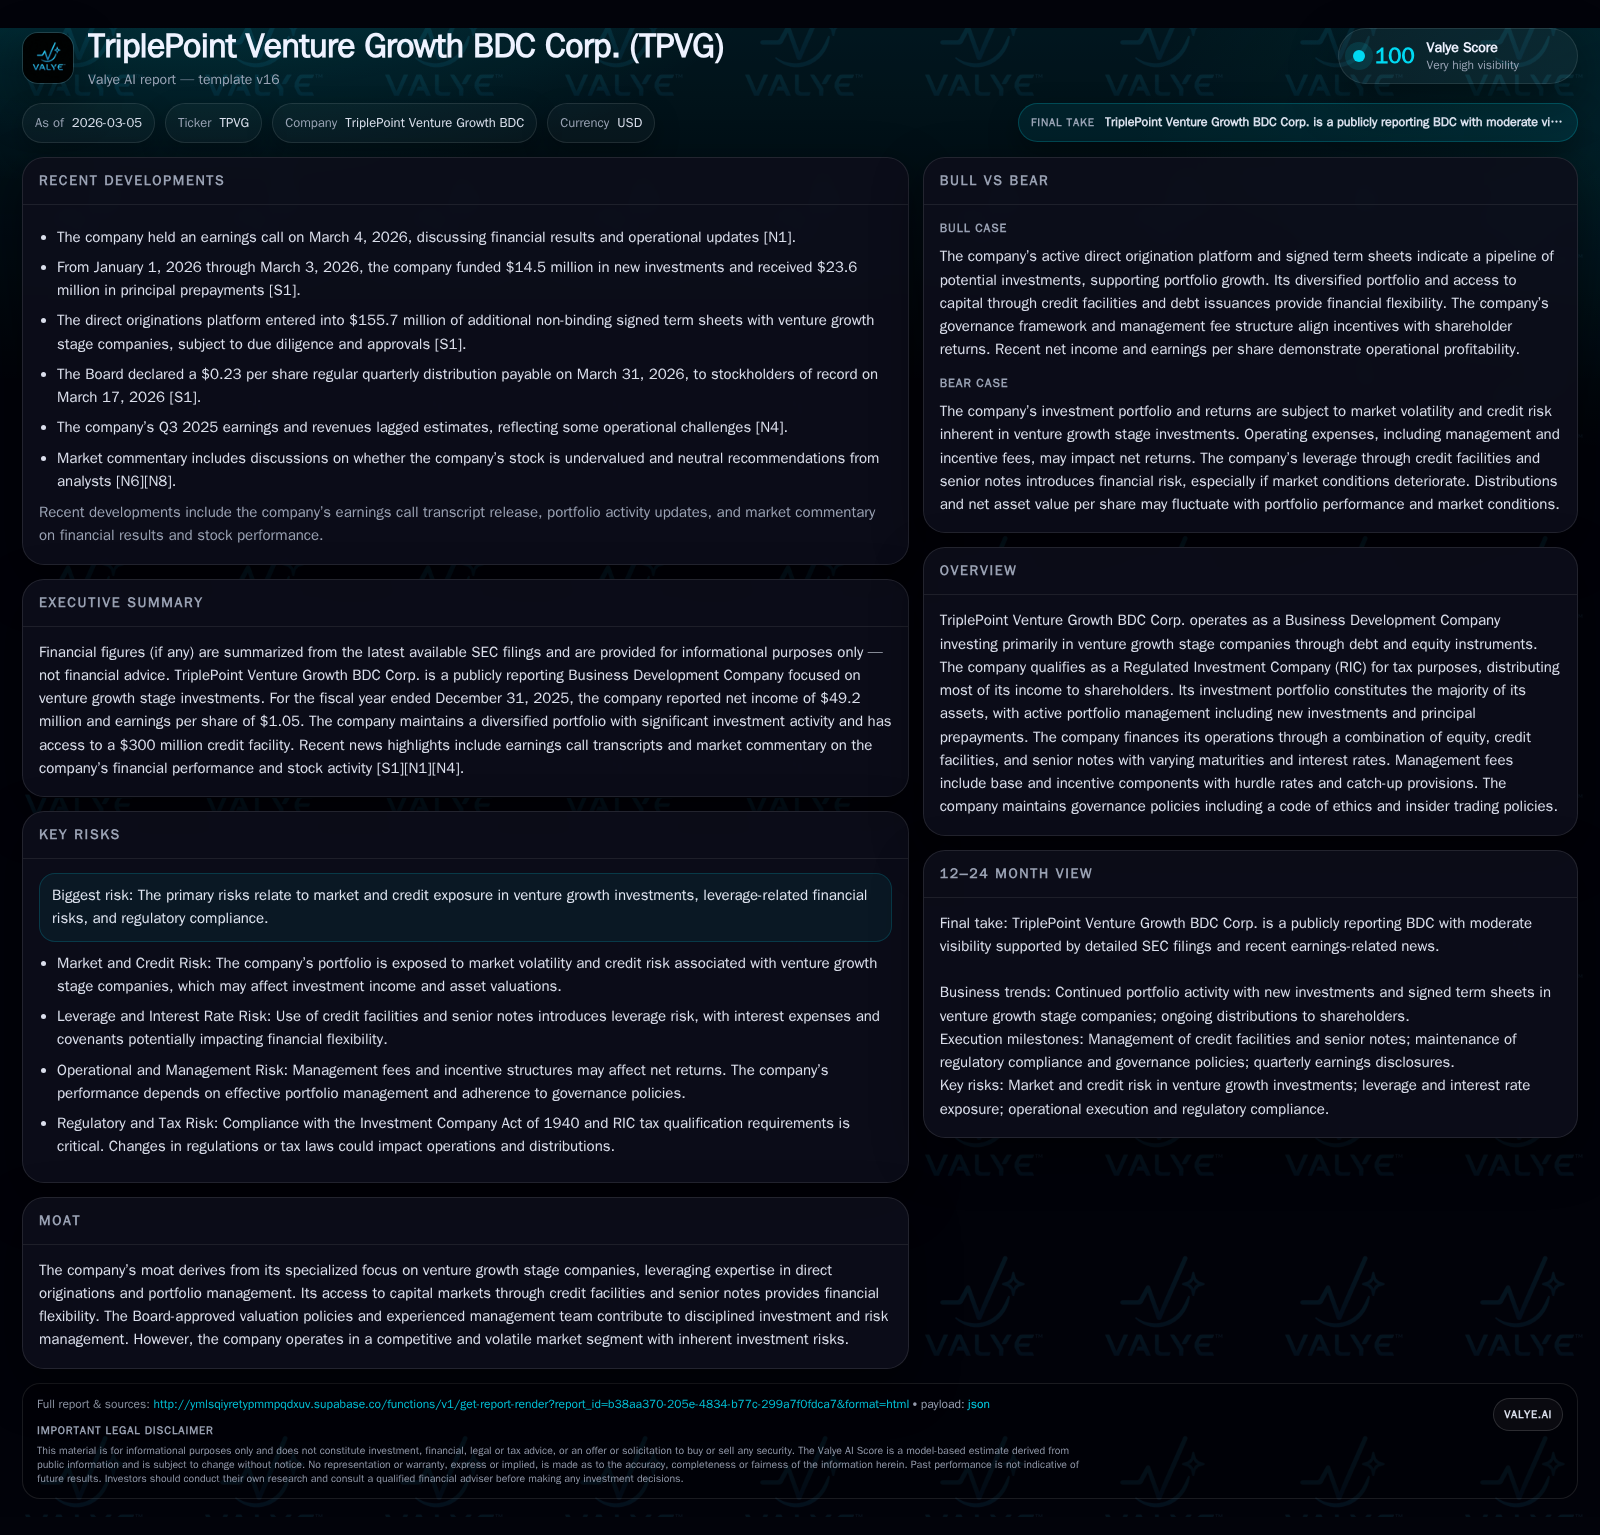
TriplePoint Venture Growth BDC Corp. delivered a 54% rise in net income for FY2025 to $49.2 million, recovering from prior losses, as the company adjusted to falling interest rates impacting yields. The business development company grew its investment portfolio to represent over 93% of assets while actively managing credit facilities and senior notes, including repaying the maturing $200 million 2026 Notes with proceeds from a recent $75 million private note offering. Despite softer operating cash flow, TPVG maintained a disciplined approach to dividends and capital allocation while expanding unfunded commitments substantially year-over-year.
Company Overview
TriplePoint Venture Growth BDC Corp. (TPVG) operates as a Business Development Company focusing exclusively on venture growth stage companies through debt and equity financing instruments. Organized as a Regulated Investment Company (RIC), TPVG distributes the majority of its earnings to shareholders while managing an actively evolving investment portfolio [S1]. This niche focus—leveraging direct origination capabilities and board-approved valuation policies—forms its competitive moat within the capital markets for fast-growing private companies.
Historical Financial Performance
Over the recent three-year period, TPVG’s financial results exhibit significant volatility driven by interest rate movements affecting portfolio yield, realized/unrealized gains/losses on investments, and active portfolio management including prepayment activity and new funding commitments.
Historical performance (annual)
| FY | Net ($mm) | CFO ($mm) | Net YoY |
|---|---|---|---|
| 2025 | 49 | -57 | +53.6% |
| 2024 | 32 | 153 | +180.5% |
| 2023 | -40 | 106 | |
| 2022 | -101 |
Source: SEC companyfacts cache [F1].
Capital returns and efficiency (annual)
| FY | ROE% |
|---|---|
| 2025 | 13.9 |
| 2024 | 9.3 |
| 2023 | -11.5 |
| 2022 |
Source: SEC companyfacts cache [F1]. ~13.9% | 2024 | 32.0 | 152.9 | 345.7 | +180% vs '23* | +44% vs '23* | ~9.3% | 2023 | -39.8 | 106.1 | 346.3 | N/A | N/A | Negative|
*Note: Prior-year comparisons show sharp turnaround from previous losses [F1][S1].
FY2025 marked a return to profitability with net income increasing by more than half year-over-year amid reduced investment income stemming from declines in benchmark Prime Rate yields impacting the debt portfolio’s coupon returns [S1]. Despite the decline in yield-driven income—from $108.6 million total investment/other income in 2024 to $90.9 million in 2025—the company offset some margin pressure through an income incentive fee waiver amounting to $5.3 million, contributing positively to net investment income [S1].
Operating cash flows reversed dramatically, reflecting intensified deployment into new investments as well as prepayments and sales activity: net cash used in operating activities was -$57 million compared with positive inflows exceeding $150 million in the previous year [F1][S6]. Equity capital remained mostly stable as the company raised capital under updated At-The-Market (ATM) offerings alongside its credit facility borrowings [S8].
Investment Portfolio and Credit Exposure
As of December 31, 2025, TPVG’s investment portfolio accounted for approximately 93.3% of total assets up from 88.6% at the end of 2024, demonstrating deeper capital commitment [S11]. This higher concentration aligns with increased unfunded commitments that nearly tripled year-over-year—rising from roughly $104 million to $260 million—signaling aggressive deployment into venture-stage companies across multiple sectors [S17]. Some commitments are milestone-dependent, reflecting structured funding arrangements tied to portfolio company performance.
The weighted average yield on debt investments decreased due to external rate movements; however, the direct origination model provides opportunities for custom structures including warrants or equity kickers that enhance return profiles.
Capital Structure and Liquidity Management
TPVG employs a multi-layered financing strategy combining equity capital raises via ATM programs, revolving credit facilities, and unsecured senior notes with staggered maturities [S4][S7]. As of December 31, 2025, borrowings under the Credit Facility stood at $95 million with availability remaining intact under a $300 million commitment that can be expanded up to $400 million via accordion feature [S4][S8]. The company comfortably maintained asset coverage at approximately 175%, surpassing the reduced regulatory minimum of 150%, allowing flexibility for leverage management [S8].
A key milestone was the repayment in full of the outstanding $200 million principal amount of the maturing 2026 Notes in early March 2026, utilizing proceeds from a private placement of new $75 million senior unsecured notes bearing an elevated fixed rate of 7.50%, supplemented by additional credit facility borrowings and cash on hand [S25]. This refinancing reduced short-term maturity risk and incrementally increased cost of borrowing compared with older issuance rates but reflects market conditions.
Additional senior unsecured notes include $125 million due in February 2027 at a fixed coupon of 5%, and previously issued notes bearing an effective interest cost approximating between roughly mid-4% and high single digits depending on series [S7][S25].
Fee Structure and Expenses
Management fees consist of base fees set as percentage of assets under management plus incentive fees linked to performance hurdles with catch-up provisions [S1][S26]. The adviser has waived income incentive fees worth over $5 million during FY2025 through continuation agreements extending until end of FY2026—aimed at preserving net investment income amid compressed yields [S1]. Operating expenses decreased slightly compared with prior year mainly due to portfolio size contraction affecting base fee calculations.
Interest expense correspondingly fell from $30.4 million in FY2024 to $26.5 million for FY2025 because of lower weighted average debt balances following repayments; however rising interest rates on newly issued notes may pressure expenses going forward [S1][S26].
Dividend Policy and Capital Returns
TriplePoint has consistently paid quarterly regular dividends since inception; most recently declaring a $0.23 per share distribution payable March 31, 2026 [N1][S9]. Dividends predominantly derive from qualifying net investment income as required by RIC tax status.
Distribution policy continues emphasizing ordinary income distributions consistent with historical patterns where around four-fifths comprised qualified interest income for tax purposes [S15][N1]. The company provides shareholders optional participation via dividend reinvestment plans funded either through issuance of new shares or open market purchases.
Outlook and Future Considerations (Analysis)
TPVG’s future growth hinges on several critical variables:
- Ability to source attractive venture growth stage credits amid increasingly competitive direct lending markets.
- Managing interest rate exposure given sensitivity of floating rate loan yields versus fixed-coupon debt financing costs.
- Execution on deployment plans showcased by increasing unfunded commitments that may translate into funded investments subject to diligence;
- Navigating potential regulatory changes impacting BDC leverage structures or tax treatment;
- Maintaining disciplined capital allocation balancing shareholder distributions with reinvestment needs.
Investor attention should monitor:
- Quarterly updates on new investment originations,
- Changes in incentive fee waiver status beyond end-2026,
- Leverage metrics relative to asset coverage ratio,
- Credit quality trends within portfolio companies,
- Impact of interest rate cycles on earnings yield spread,
- Any equity issuance activity under ATM programs or otherwise.
Sector Context (Analysis)
BDCs like TPVG that specialize in venture growth lending operate with inherent cyclical risk exposures linked both to market sentiment toward riskier assets and broader economic conditions influencing venture fundraising environments and exit liquidity scenarios for startups. Enhanced regulatory flexibility enabling lower asset coverage thresholds (150% vs historical 200%) permits greater leverage usage but also escalates susceptibility during downturns requiring robust risk management frameworks. Success depends heavily on experienced origination teams able to structure loans incorporating equity upside via warrants or convertible features mitigating downside volatility.
Conclusion
TriplePoint Venture Growth BDC Corp demonstrates resilience moving into FY2026 via strategic recalibration of its debt maturities coupled with ongoing expansion of its investment pipeline evidenced by surging unfunded commitments—indicating confidence in sourcing prospective growth-stage financings despite macro pressures exerted by declining base rates suppressing yield returns. Financial results reveal recovering profitability after prior losses but spotlight challenges related to operating cash flow volatility tied closely to investment fundings dynamics. Disciplined governance led by board-approved valuation methodologies supports prudent capital deployment amid an inherently volatile segment. Steady dividend payments reaffirm commitment to shareholder returns within regulated RIC constraints balanced against evolving business needs. Investors should assess how management navigates these tradeoffs while executing growth strategies in competitive direct lending markets for venture companies.
This report is based solely on publicly available information as of March 5, 2026, including TriplePoint Venture Growth BDC Corp.’s filings on form S-1K dated March 4, earnings call transcripts dated March 4 [N1][N2], and SEC filings [S1–S29], complemented by validated numerical data sets [F1]. It does not contain any investment recommendations or price targets and is intended purely for informational purposes.
Disclaimer: This is research-only, informational analysis and not investment advice. It may include AI-generated interpretation and general industry context. Always verify important details using primary sources.
Comments