
B&G Foods Revives Operating Income but Faces Persistent Net Losses
The company posted a strong rebound in operating income for FY2026 but continues to incur net losses amid ongoing challenges from cost inflation and customer concentration.
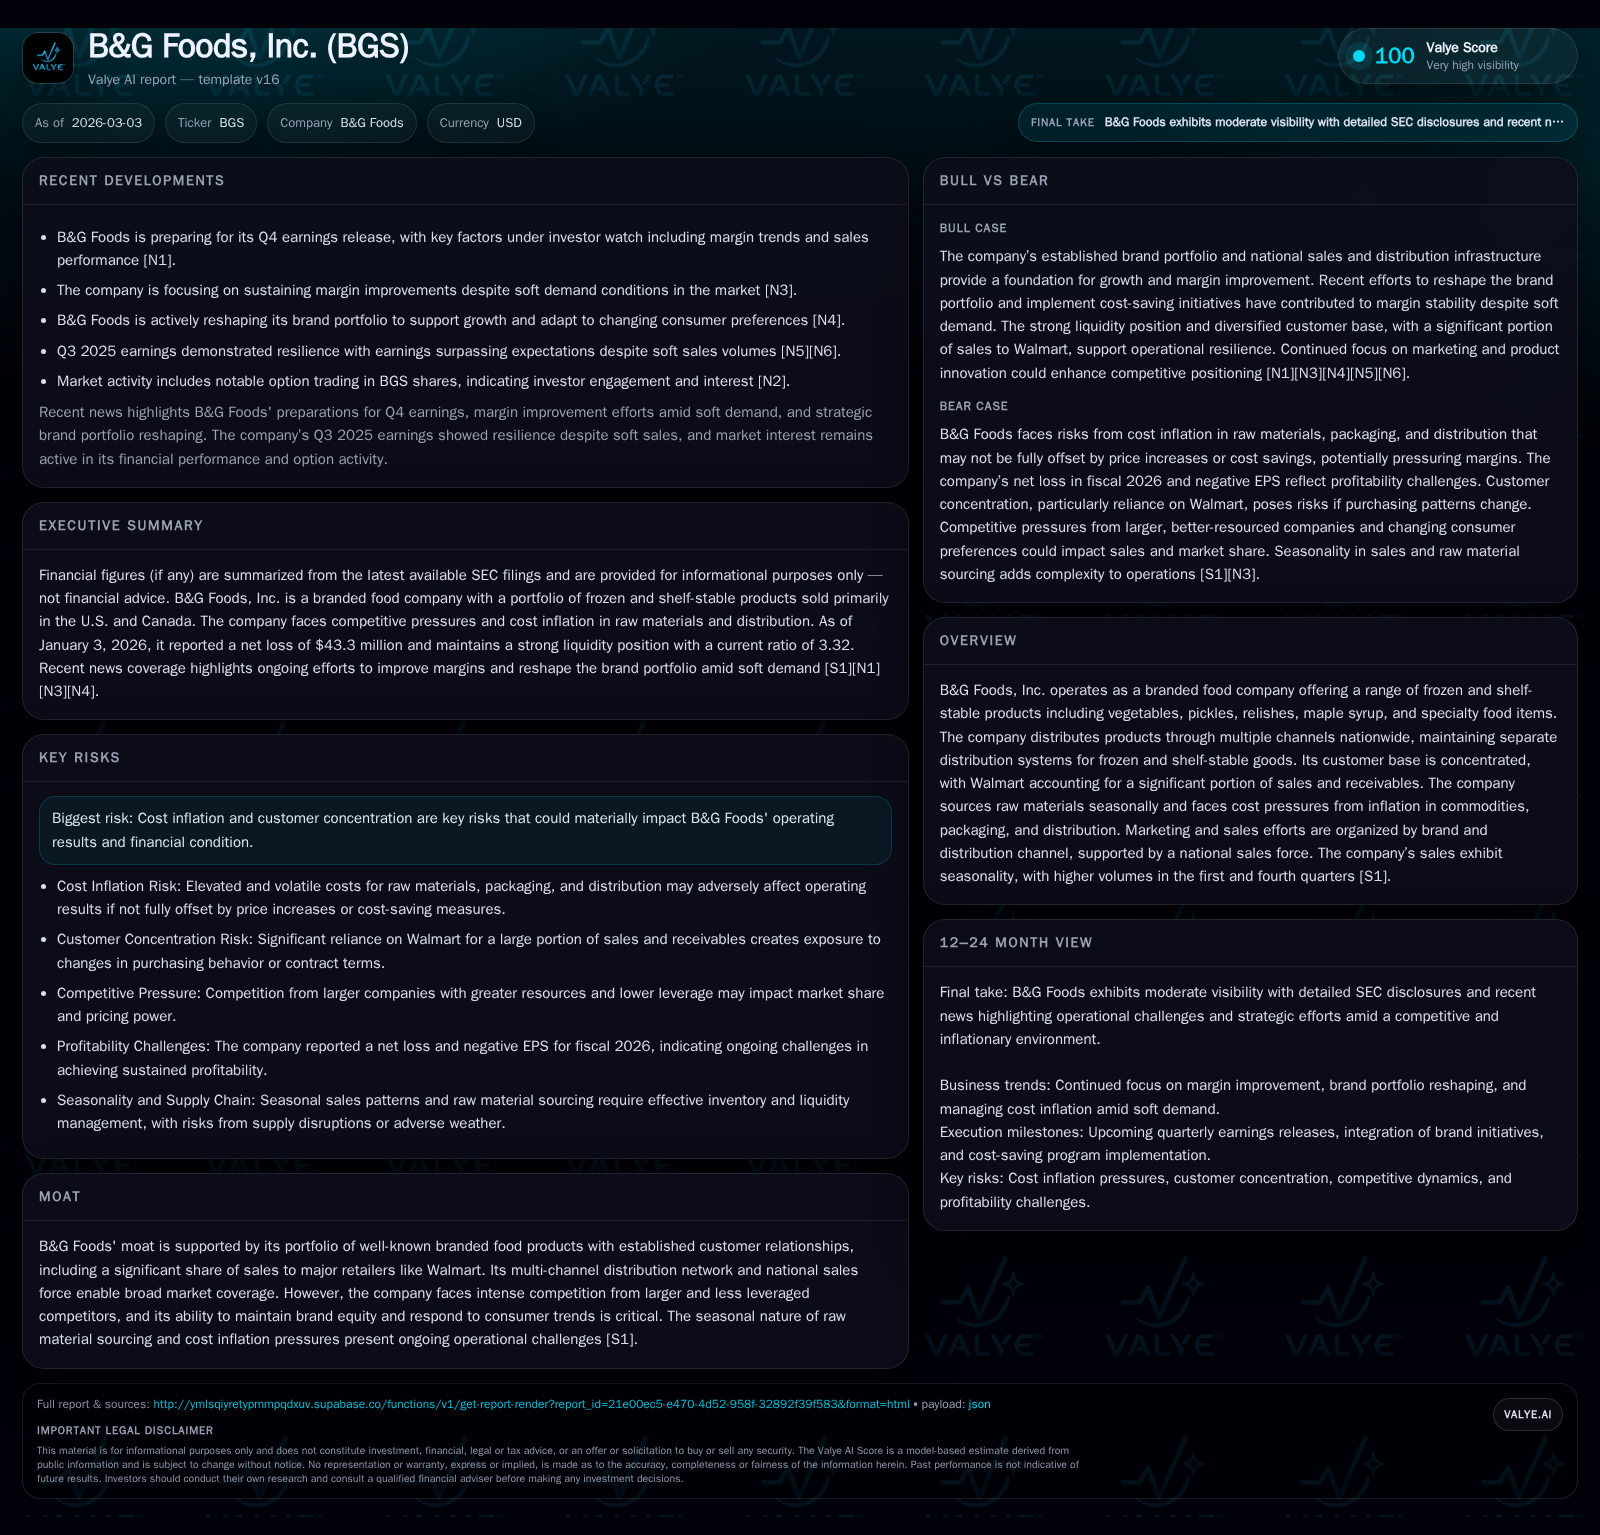
B&G Foods, Inc. demonstrated a notable turnaround in operating income for fiscal 2026, jumping 154.8% year-over-year to $97.1 million. However, net losses persisted at $43.3 million despite improved operational performance. Cost pressures from seasonal raw material sourcing, elevated freight rates, and intense competition weigh on margins, while Walmart accounts for roughly a third of sales, exposing the firm to significant customer concentration risk. The company maintains a healthy liquidity position with a current ratio above 3x but carries substantial leverage that limits financial flexibility. Dividends continue amid free cash flow generation of approximately $70.7 million, though negative return on equity underscores ongoing profitability challenges.
Operating Income Recovery Contrasted by Negative Net Earnings
B&G Foods achieved a sharp rebound in operating income for fiscal year 2026, reporting $97.15 million, an increase of approximately 154.8% compared to prior periods [F1]. This rebound reflects operational improvements following two years marked by significant earnings volatility including a steep operating loss reported in FY2024 (-$177 million). Despite this notable recovery at the operating level, the company continues to report net losses totaling -$43.26 million in FY2026, though this is an improvement over prior net losses of -$251 million in FY2024 [F1]. The persistence of negative net earnings amidst improved operating results suggests burdens from structural costs such as interest expense on debt or non-operating charges that suppress bottom-line profitability.
Seasonal Product Sourcing and Distribution Networks Under Cost Stress
B&G Foods' supply chain complexity is underscored by its reliance on seasonal raw material sourcing patterns that affect working capital needs and cost structures [S1][S4][S6]. The company predominantly purchases produce—corn, peas, broccoli—and maple syrup during defined periods from April through October to support its frozen and shelf-stable vegetables and specialty products [S6]. This seasonality requires heightened liquidity during harvest months as well as precise inventory management.
Distribution employs distinct systems tailored to product types: six primary distribution centers support shelf-stable goods with a combination of leased facilities operated by third parties and owned centers, while a network of seven distribution centers managed entirely by third-party logistics providers handles frozen products [S4]. The frozen distribution system is currently transitioning toward new ownership arrangements linked to recent divestitures.
Freight rate inflation has been a persistent headwind over recent years and remains elevated into FY2026, driven by industry-wide surcharges affecting third-party logistics contracts [S4]. B&G Foods attempts to mitigate these pressures via targeted price increases and operational efficiencies; however, these measures have only partially offset rising costs leading to margin compression risks.
Customer Concentration: Walmart’s Overwhelming Sales Share
A crucial risk factor for B&G Foods is customer concentration concentrated heavily around Walmart which represented approximately 31% of net sales in fiscal 2025 and accounted for roughly 39% of accounts receivable as of January 3, 2026 [S6]. No other single customer contributes more than 10% of revenue or receivables.
This dependence creates stable volume assurances but imposes vulnerability should Walmart alter purchasing terms or reduce orders. In addition, credit concentration risk hampers cash flow visibility given the magnitude of outstanding receivables tied to one retailer [S4][S6]. Aside from Walmart, the top ten customers collectively cover about two-thirds of sales highlighting moderate but not extensive diversification.
Competitive Environment and Brand Equity Challenges
B&G Foods operates in a highly competitive branded food sector facing rivals with notably greater scale and financial resources [S1][S6]. The company’s strategy leverages recognizable brands within frozen vegetables, pickles, specialty foods and more; however, sustaining brand equity requires continuous investments in consumer marketing including trade promotions such as coupons and cross-promotions supported by radio and social media advertising [S1][S4].
Competition also arises from private label products which exert pricing pressure across categories such as shelf-stable pickles competing not only with branded but also refrigerated alternatives [S21]. The necessity to innovate product lines and respond swiftly to changing consumer trends is ongoing given limited economies of scale relative to industry giants.
Capital Structure Review: Leverage and Liquidity Dynamics
Financial flexibility is constricted by substantial leverage embedded in multiple debt tranches including senior secured notes at coupon rates around 5.25%–8% maturing between 2025–2029 as well as term loans expiring circa 2029 [S5][S7][F1]. Despite this, B&G Foods maintains solid liquidity metrics – notably a current ratio exceeding 3.3x driven by $739.8 million in current assets against $222.8 million current liabilities at the fiscal year-end [F1].
This robust short-term liquidity supports working capital needs exacerbated by seasonal inventory build and cost inflation pressures but servicing long-term obligations constrains discretionary spending on growth or deleveraging initiatives.
Capital Allocation Priorities: Dividends Amid Cash Flow Pressures
B&G Foods allocated $60.6 million toward dividends in FY2026 while generating free cash flow (operating cash flow minus capex) of approximately $70.7 million [F1][S14]. Dividend payments have remained consistent even though net income remains negative indicating management prioritizes shareholder distributions within cash flow constraints rather than relying solely on accounting profits.
Capital expenditures rose modestly by about 12.4% YoY to $30.65 million reflecting ongoing investment in manufacturing or distribution infrastructure although no recent share repurchases are evident contrasting with buyback spending observed historically before FY2022 [F1]. Return on equity remains negative near -9.6%, confirming challenges in translating operational gains into profitability returns reflecting leverage costs.
Historical Financial Performance Summary
Historical performance (annual)
| FY | Net ($mm) | CFO ($mm) | OpInc ($mm) | Capex ($mm) | Net YoY |
|---|---|---|---|---|---|
| 2026 | -43 | 101 | 97 | 31 | |
| 2024 | -251 | 131 | -177 | 27 | -279.5% |
| 2023 | -66 | 248 | 80 | -482.2% | |
| 2022 | -11 | 6 | 99 | 22 |
Source: SEC companyfacts cache [F1].
Capital returns and efficiency (annual)
| FY | Div ($mm) | FCF ($mm) | ROE% |
|---|---|---|---|
| 2026 | 61 | 71 | -9.6 |
| 2024 | 60 | 104 | -47.9 |
| 2023 | 56 | -7.9 | |
| 2022 | 133 | -16 | -1.3 |
Source: SEC companyfacts cache [F1].
Operating income shows sharp recovery in FY2026 despite lingering net losses reflecting finance costs or other non-operating expenses.
Outlook Considerations
While explicit forward-looking guidance post-FY2026 has not been disclosed publicly [N1][N2][S3], key factors warranting attention include sustainability of margin improvements amid softening demand trends noted recently, ability to withstand continued inflationary input pressures without eroding volume or prompting aggressive discounting, and evolution in the customer base particularly Walmart’s buying patterns [N2][N1]. Further scrutiny should be given to potential impacts from ongoing divestiture activity including U.S./Canadian frozen brands transitioning distribution partnerships which may affect supply chain efficiency or cost structures [S4]. Close tracking of trade promotion effectiveness will also signal whether brand loyalty can be preserved against competitor incursions.
This analysis synthesizes SEC filings through early March 2026 alongside recent market commentary without extending speculative forecasts beyond disclosed metrics or commentary.
DISCLAIMER: This memorandum is prepared exclusively for informational purposes intended for institutional analysis and internal use only; it does not constitute investment advice or recommendations regarding securities transactions.
Disclaimer: This is research-only, informational analysis and not investment advice. It may include AI-generated interpretation and general industry context. Always verify important details using primary sources.
Comments