
Buckle Inc. Penetrates New Earnings Terrain with Incentive-Aligned Growth
Buckle’s recent operating income surge reflects an incentive-driven management strategy alongside solid capital discipline and measured sales momentum.
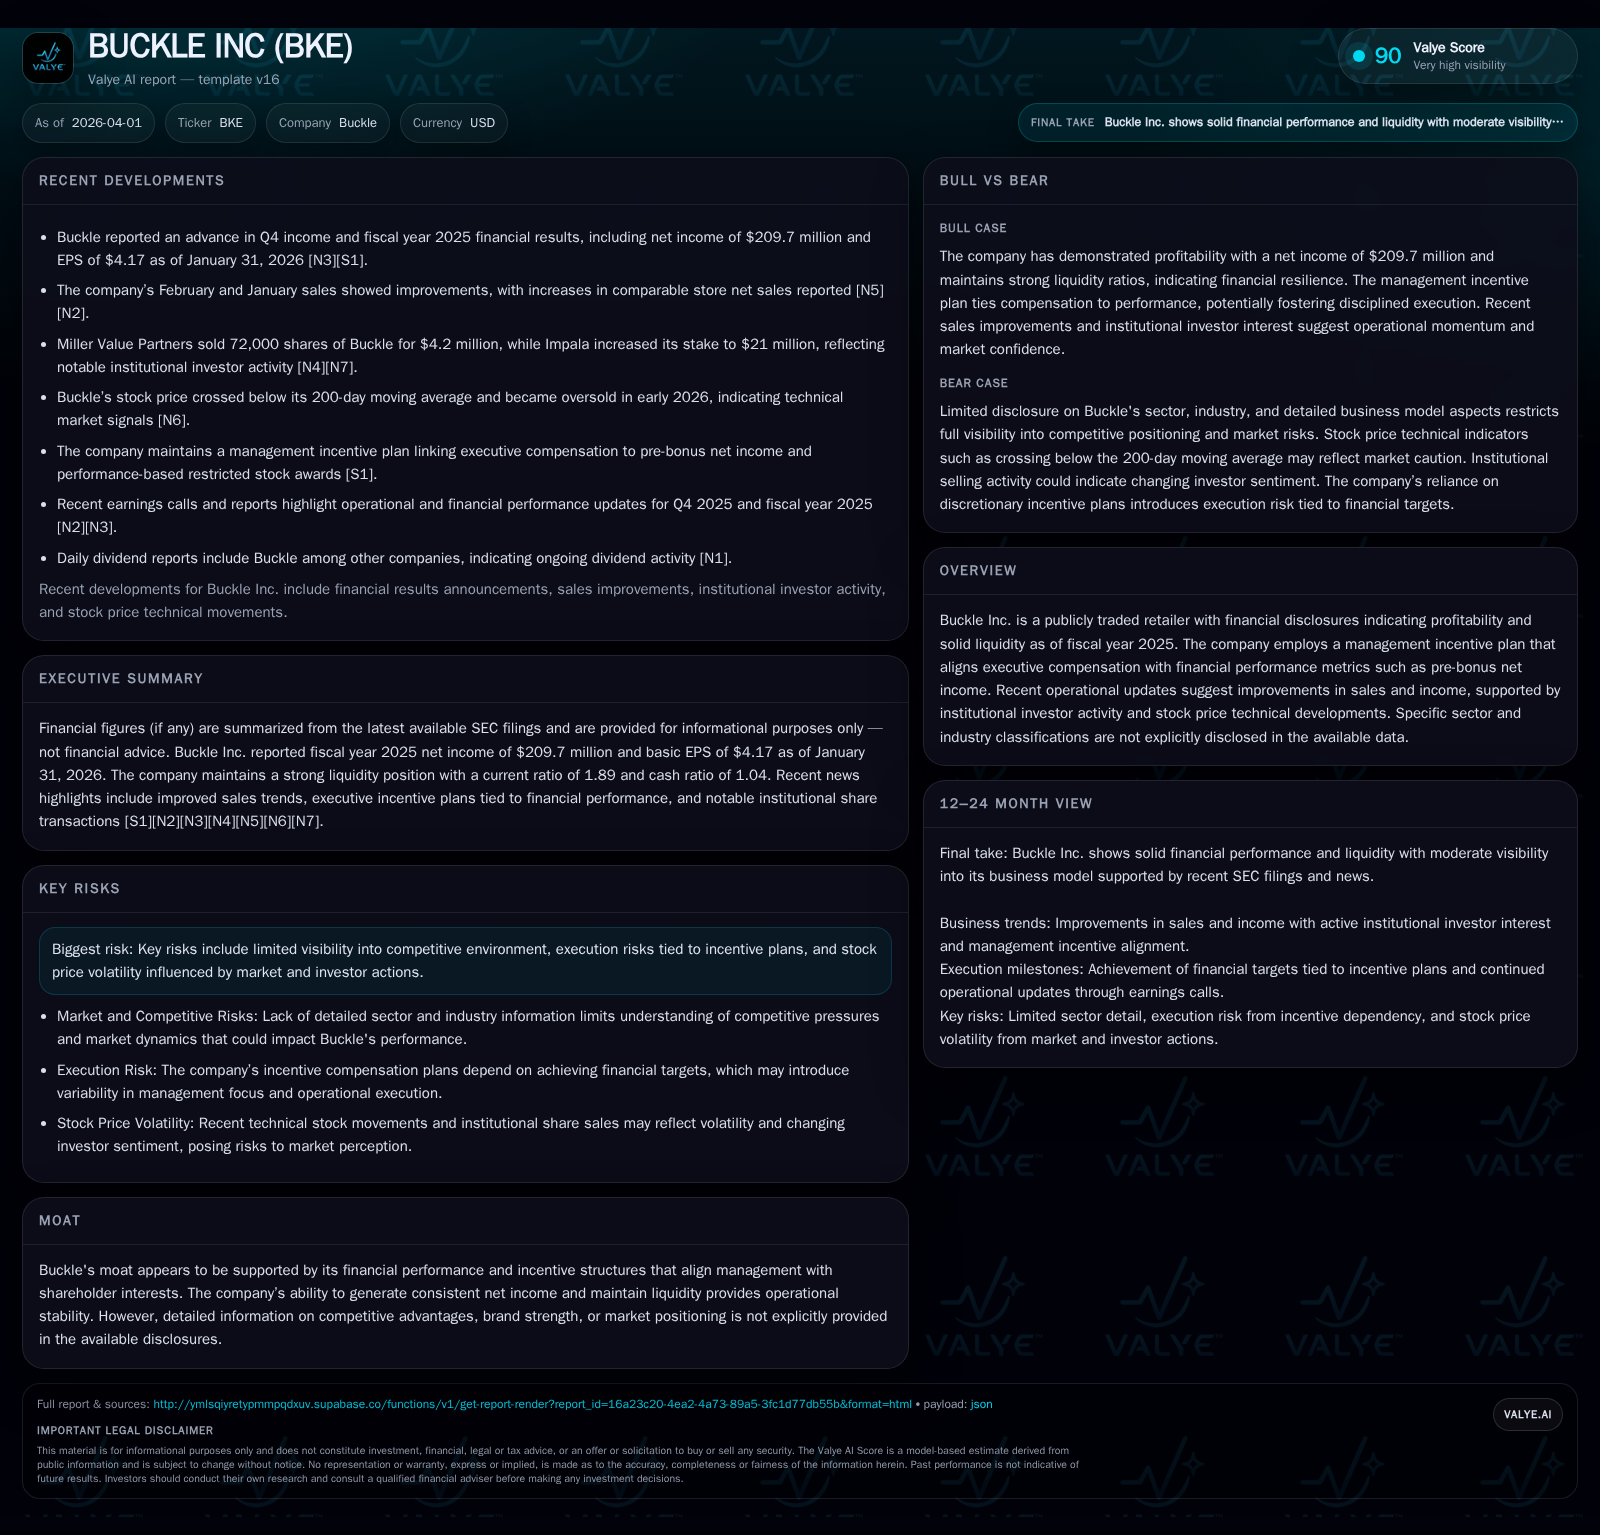
In fiscal 2025, Buckle Inc. delivered a notable uptick in operating income (+8.3% YoY) and net income (+7.3% YoY), underpinned by consistent revenue and robust cash flow generation. This profit expansion aligns closely with the company’s management incentive plan linking executive compensation to pre-bonus net income targets and operational performance metrics. Meanwhile, recent sales improvements signal cautious optimism for sustained growth amid emerging execution risks and market volatility. Buckle’s capital allocation continues to favor dividends supported by strong free cash flow, with share repurchases remaining minimal.
Financial Footprint: Buckle’s Historic Revenue and Income Trends through FY2025
Buckle Inc.’s financial profile over the past four fiscal years reveals a resilient revenue base with strategic margin enhancements driving earnings improvement. Revenue held steady at approximately $281 million in FY2025, up slightly from $280 million the previous year—a negligible 0.4% increase indicating stable top-line conditions [F1]. Contrasting this flat revenue trajectory, operating income accelerated notably by 8.3% to $261 million in FY2025 from $241 million in FY2024 [F1]. This divergence reflects operating margin leverage potentially from expense control or product mix.
Net income tracked similarly with an increase of 7.3%, rising to roughly $210 million in FY2025 against $195 million the prior year [F1]. This progression supported an elevated return on equity hovering around 49%, underscoring efficient capital deployment given an equity base just above $424 million [F1].
Operating cash flow increased modestly by nearly 4% to $251 million while capital expenditures grew by about 7% to $45 million, balancing reinvestment needs with liquidity preservation [F1]. The resultant free cash flow approximation of $206 million highlights strong cash generation capacity.
Historical performance (annual)
| FY | Net ($mm) | CFO ($mm) | OpInc ($mm) | Capex ($mm) | Net YoY |
|---|---|---|---|---|---|
| 2025 | 210 | 251 | 261 | 45 | +7.3% |
| 2024 | 195 | 242 | 241 | 42 | -11.1% |
| 2023 | 220 | 255 | 271 | 37 | -13.6% |
| 2022 | 255 | 242 | 328 | 30 |
Source: SEC companyfacts cache [F1].
Capital returns and efficiency (annual)
| FY | Div ($mm) | FCF ($mm) | ROE% |
|---|---|---|---|
| 2025 | 225 | 206 | 49.4 |
| 2024 | 198 | 200 | 46.1 |
| 2023 | 197 | 217 | 53.2 |
| 2022 | 203 | 212 | 67.7 |
Source: SEC companyfacts cache [F1].
Note: FY2017–FY2016 revenue data not included due to earlier period focus; detailed data up to FY2025 available for key metrics.
Incentive-Driven Management: How Compensation Programs Fuel Performance
A core element differentiating Buckle is its structured approach to executive compensation closely aligned with shareholder interests through a defined Management Incentive Plan mainly based on achieving pre-bonus net income targets [S10][S12][S14]. The plan establishes a "bonus pool" funded as a percentage of pre-bonus net income — specifically featuring a base amount equal to 2.5% of that figure plus incremental increases if performance exceeds targets.
Executives are allocated shares of this pool proportionally, with the CEO receiving approximately 37% of available points under the plan [S12]. Importantly, payment eligibility requires certification of the company’s pre-bonus net income by the Compensation Committee and continued employment through fiscal year-end.
Additionally, performance-based restricted stock grants under the company’s Employee Restricted Stock Plan implement multiple layers of vesting linked either to surpassing absolute pre-bonus net income targets or exceeding specified thresholds on net income relative to sales margins—ranging from minimum targets up to aggressive levels (20% net income from operations as percent of sales) [S14][S25]. This complexity introduces rigor in incentivizing sustained profitability rather than short-term gains.
Overall, this nuanced incentive structure likely contributed materially to the FY2025 earnings upside within a disciplined framework balancing compensation expense against stockholder value enhancement.
Recent Sales and Earnings Signals: February Momentum and Q4 Outcomes
Operational updates through early calendar year suggest incremental momentum supporting Buckle’s recent financial headlines. February sales showed improvement following a more muted year-end environment [N5], complementing positive commentary on Q4 fiscal results where earnings advanced amid controlled expenses [N1][N3].
While exact magnitudes remain modest relative to overall scale, these signals hint at potential stabilization or slow growth resumption after prior flatness in comparable store trends — an encouraging sign given retail sector variability.
Nonetheless, caution is warranted assessing durability; during Q4 conference calls management emphasized ongoing vigilance given inflationary pressures and shifting consumer preferences [N1]. Such dynamics could temper upside trajectory despite current positive inflections.
Outlook Terrain: Growth Prospects Coupled with Execution and Market Risks
Looking ahead, Buckle faces both opportunities and tangible risks shaping its growth runway. Prospects hinge largely on continued achievement against pre-bonus net income benchmarks that drive executive incentives motivating strategic decisions aligned with profitability objectives [S9][S6].
However, external factors introduce complexity including evolving competitive dynamics obscured by limited public detail on market positioning or brand strengths [S6]. Execution risks also surface given reliance on multifaceted incentive plans whose outcomes depend on precise financial target attainment alongside workforce retention amid recent senior leadership retirements [S28][S29].
Equally relevant is the potential impact of recent institutional investor activity; Miller Value Partners’ disposal of approximately 72,000 shares worth over $4 million injects selling pressure considerations alongside technical indicators such as breaking below the stock’s long-term moving average offering cautionary signals on price momentum [N4][N6].
These market developments underscore volatility risk overlaying fundamental earnings narratives.
Capital Allocation Blueprint: Dividends, Free Cash Flow, and Shareholder Returns
Buckle exhibits disciplined capital deployment prioritizing consistent dividends supported by high-quality free cash flow conversion [F1][S10][S11][S13][S15]. In fiscal 2025 alone, dividend distributions approached $225 million—a notable increase from prior years reflecting confidence in operating liquidity underpinning shareholder returns.
Free cash flow remains robust at roughly $206 million annually after accounting for controlled capex outlays focused partly on store refurbishments or technology enhancements sustaining competitiveness without excess spending pressure [F1].
Conversely, share repurchase activity has been negligible in recent years—reflecting either valuation considerations or preference for direct dividend returns—aligning with common practice among mid-cap retailers who often favor stability amid sector fluctuations.
What To Watch Next: Key Milestones and Financial Metrics on the Horizon
Looking forward, critical forthcoming events include monitoring the certification of fiscal year pre-bonus net income figures which directly influence annual bonus pool determinations under existing incentive frameworks [N2][S3][S13]. Such certifications act as pivotal inflection points potentially affecting market perception and executive reward timing.
Dividend record dates (next payable April 29, 2026) provide additional near-term liquidity insights alongside subsequent quarterly earnings releases that will validate whether recent operational progress sustains beyond Q4 strength and February sales upticks.
Market participants should also observe any updates related to further executive transitions or shifts within key roles influencing strategic execution risks noted earlier.
This analysis synthesizes verified financial data and company disclosures without extending speculative forecasts or investment views. It aims solely to delineate Buckle Inc.’s recent financial evolution, incentive-aligned management posture, capital strategy, and risk context as per documented evidence.
Disclaimer: This is research-only, informational analysis and not investment advice. It may include AI-generated interpretation and general industry context. Always verify important details using primary sources.
Comments