
Namib Minerals’ Mining Operations Face Liquidity and Leadership Transition Amid Zimbabwe Challenges
Despite a marked decline in gold production during 2025, Namib Minerals reported significant net income, highlighting operational and financial complexities.
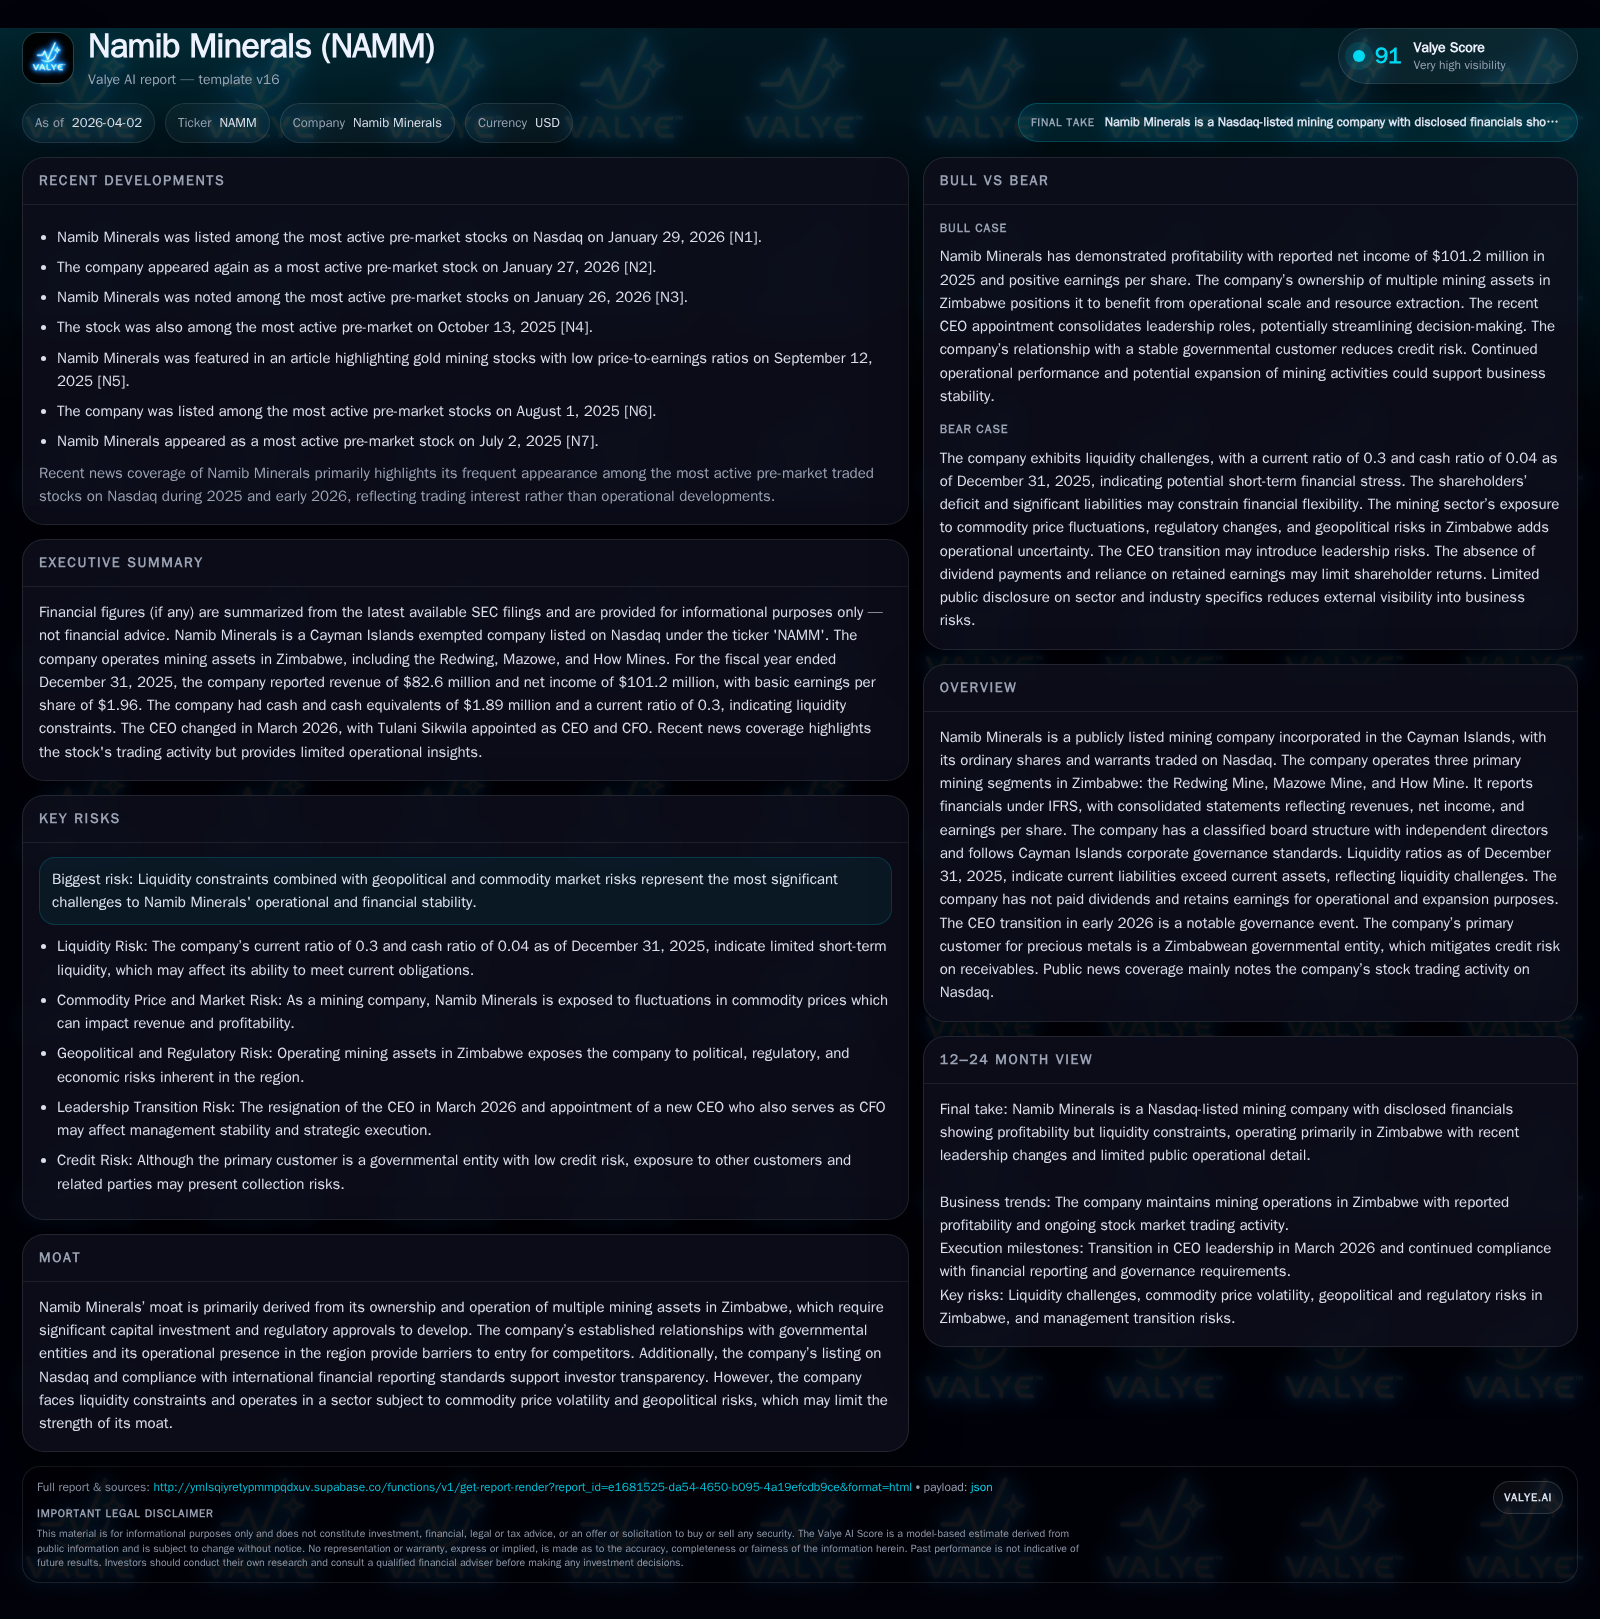
Namib Minerals experienced a substantial drop in gold production from 37koz in 2024 to 25koz in 2025, while revenues reached $82.6 million and net income exceeded $101 million, pointing to unusual profitability drivers potentially related to pricing or one-time events. Liquidity remains a serious concern, evidenced by a low current ratio of 0.3 and a Debt Service Coverage Ratio reduction from 5.29:1 to 2.04:1 over the last year. Leadership changes with the CEO resignation in early 2026 add to the uncertainty as the company navigates Zimbabwe's complex mining environment characterized by regulatory challenges and artisanal mining impacts. Capital allocation continues to prioritize retention of earnings for operational use, with no dividends paid and warrants outstanding under restricted exercise conditions.
Historical Production Trends and Revenue Performance Through 2025
Namib Minerals operates three principal mines in Zimbabwe — Redwing, Mazowe, and How — each contributing to its precious metals output. The consolidated production data reveal that while ore tonnes milled held steady around 473–476kt in both 2024 and 2025, gold ounces produced plummeted from 37koz in 2024 to just 25koz in 2025 [F1][S1]. This disconnect suggests either a fall in ore grade or processing efficiency.
Despite this downturn, the company posted revenues of approximately $82.6 million alongside net income surpassing $101 million for the same period [F1]. The net income figure notably exceeds revenue, indicating complex accounting effects possibly involving asset revaluations or commodity price gains rather than pure operational earnings.
Historical performance (annual)
| FY |
|---|
| 2025 |
Source: SEC companyfacts cache [F1].
Source: Compiled from SEC filings [F1][S1]
Operational Challenges: Declining Output during Zimbabwe’s Mining Landscape
The drop-off in production has been attributed partly to the company’s reserve base dynamics as well as external pressures such as artisanal mining exclusion policies [S1][S4]. Namib Minerals reports measured and indicated Mineral Resources amounting to roughly 2.53Moz excluding Mineral Reserves which stand at about only 103koz, highlighting a narrow proven reserve buffer [S1]. Conversion of inferred resources (at around 4.42Moz) remains uncertain.
Artisanal mining near surface workings has been specifically excluded from official production figures due to its informal nature and managerial view on materiality [S1]. This factor underscores ongoing risks of theft and unauthorized mineral extraction which disrupt mine life estimates and supply consistency.
Within mine engineering circles familiar with Zimbabwe’s geology, variability of ore grades can materially affect short-term output despite constant milling volumes; it appears Namib faces such headwinds compounded by regulatory limitations impacting exploration licenses.
Liquidity Constraints and Capital Structure Dynamics
Liquidity is a critical area of concern for Namib Minerals going into late-2025. The balance sheet shows current assets of about $16.2 million overshadowed by current liabilities close to $53.6 million — yielding a precarious current ratio near only 0.3 [F1].
The company maintains borrowings inclusive of overdrafts (fully drawn $1M facility), promissory notes, and term loans secured via substantial collateral such as notarial bonds on plant/equipment ($4+ million) and hypothecation over mining leases worth $15 million [S4][S10]. Facility agreements impose monthly deposits into designated accounts ($3–4 million expected), alongside covenants requiring Debt Service Coverage Ratio (DSCR) above at least 1.2:1.
The DSCR deteriorated materially from approximately 5.29:1 at fiscal year-end December 31, 2024 down to about 2.04:1 entering December 31, 2025 [S4]. While still compliant with covenants, this decline reflects tighter cash flow coverage amid falling operational profitability.
Accounts receivable risk is mitigated by having Fidelity—a Zimbabwean government-owned entity—as the primary customer noted for consistent payment within contractual terms [S6]. Related party receivables present higher credit risk but are partially managed through offset arrangements.
Governance Shifts: CEO Exit and Board Composition Implications
On March 13, 2026 CEO Ibrahima Tall resigned without disagreement from the board; his departure included a settlement payment of approximately $834k cash plus shares totaling about 255k ordinary shares based on prevailing VWAP along with immediate vesting of all outstanding Restricted Stock Units [S3]. Tulani Sikwila assumed combined CEO-CFO duties effective the same date.
A director resignation effective April 1, 2026 also occurred without disputes or policy changes noted [S2], impacting governance stability amid operational challenges.
Capital Allocation Strategy: Dividends Policy and Share Issuances
Namib Minerals has historically not paid dividends nor plans any near-term payouts; earnings are retained for operational liquidity management and mine development investments [S18].
The capital structure includes warrants exercisable at $11.50 per share valid until five years post-Business Combination completion with redemption triggers linked to market prices limiting immediate dilution risks [S20].
The company’s return on equity stands negative due to accumulated shareholder deficit despite positive net income reported for fiscal year-end December 31, 2025 [F1].
Summary Table: Selected Financial Metrics (USD millions unless noted)
| Metric | FY2023 | FY2024 | FY2025 |
|---|---|---|---|
| Ore Tonnes Milled (kt) | 450 | 473 | 476 |
| Gold Ounces Produced (koz) | 34 | 37 | 25 |
| Revenue | - | - | 82.6 |
| Net Income | - | - | 101.2 |
| Current Assets | - | - | 16.2 |
| Current Liabilities | - | - | 53.6 |
| Current Ratio | - | - | 0.3 |
| Debt Service Coverage Ratio* | - | 5.29 | 2.04 |
| ROE (%) | - | - | -257.6 |
*DSCR values as reported for fiscal years ending December 31.
What Investors Should Monitor Going Forward
- Post-2025 production recovery efforts aiming toward prior year volumes.
- Exploration progress converting inferred mineral resources into reserves.
- Liquidity improvements including covenant compliance metrics.
- Management effectiveness under combined CEO-CFO leadership.
- Any shifts toward dividend initiation reflecting cash flow stabilization.
- Warrant exercises or changes signaling investor confidence.
Given Zimbabwe’s complex geopolitical environment alongside volatile commodity markets typical for precious metals miners operating therein, Namib Minerals’ ability to stabilize operations financially and operationally while navigating leadership transitions will be critical for future value realization.
This report synthesizes publicly available information up to filings dated April 2, 2026 without speculation or investment recommendations.
Disclaimer: This is research-only, informational analysis and not investment advice. It may include AI-generated interpretation and general industry context. Always verify important details using primary sources.
Comments