
Blink Charging Launches Growth Initiatives Amid Quarterly Losses
Q1 2026 results spotlight ongoing losses alongside strategic pushes to enhance network utilization and site-level economics.
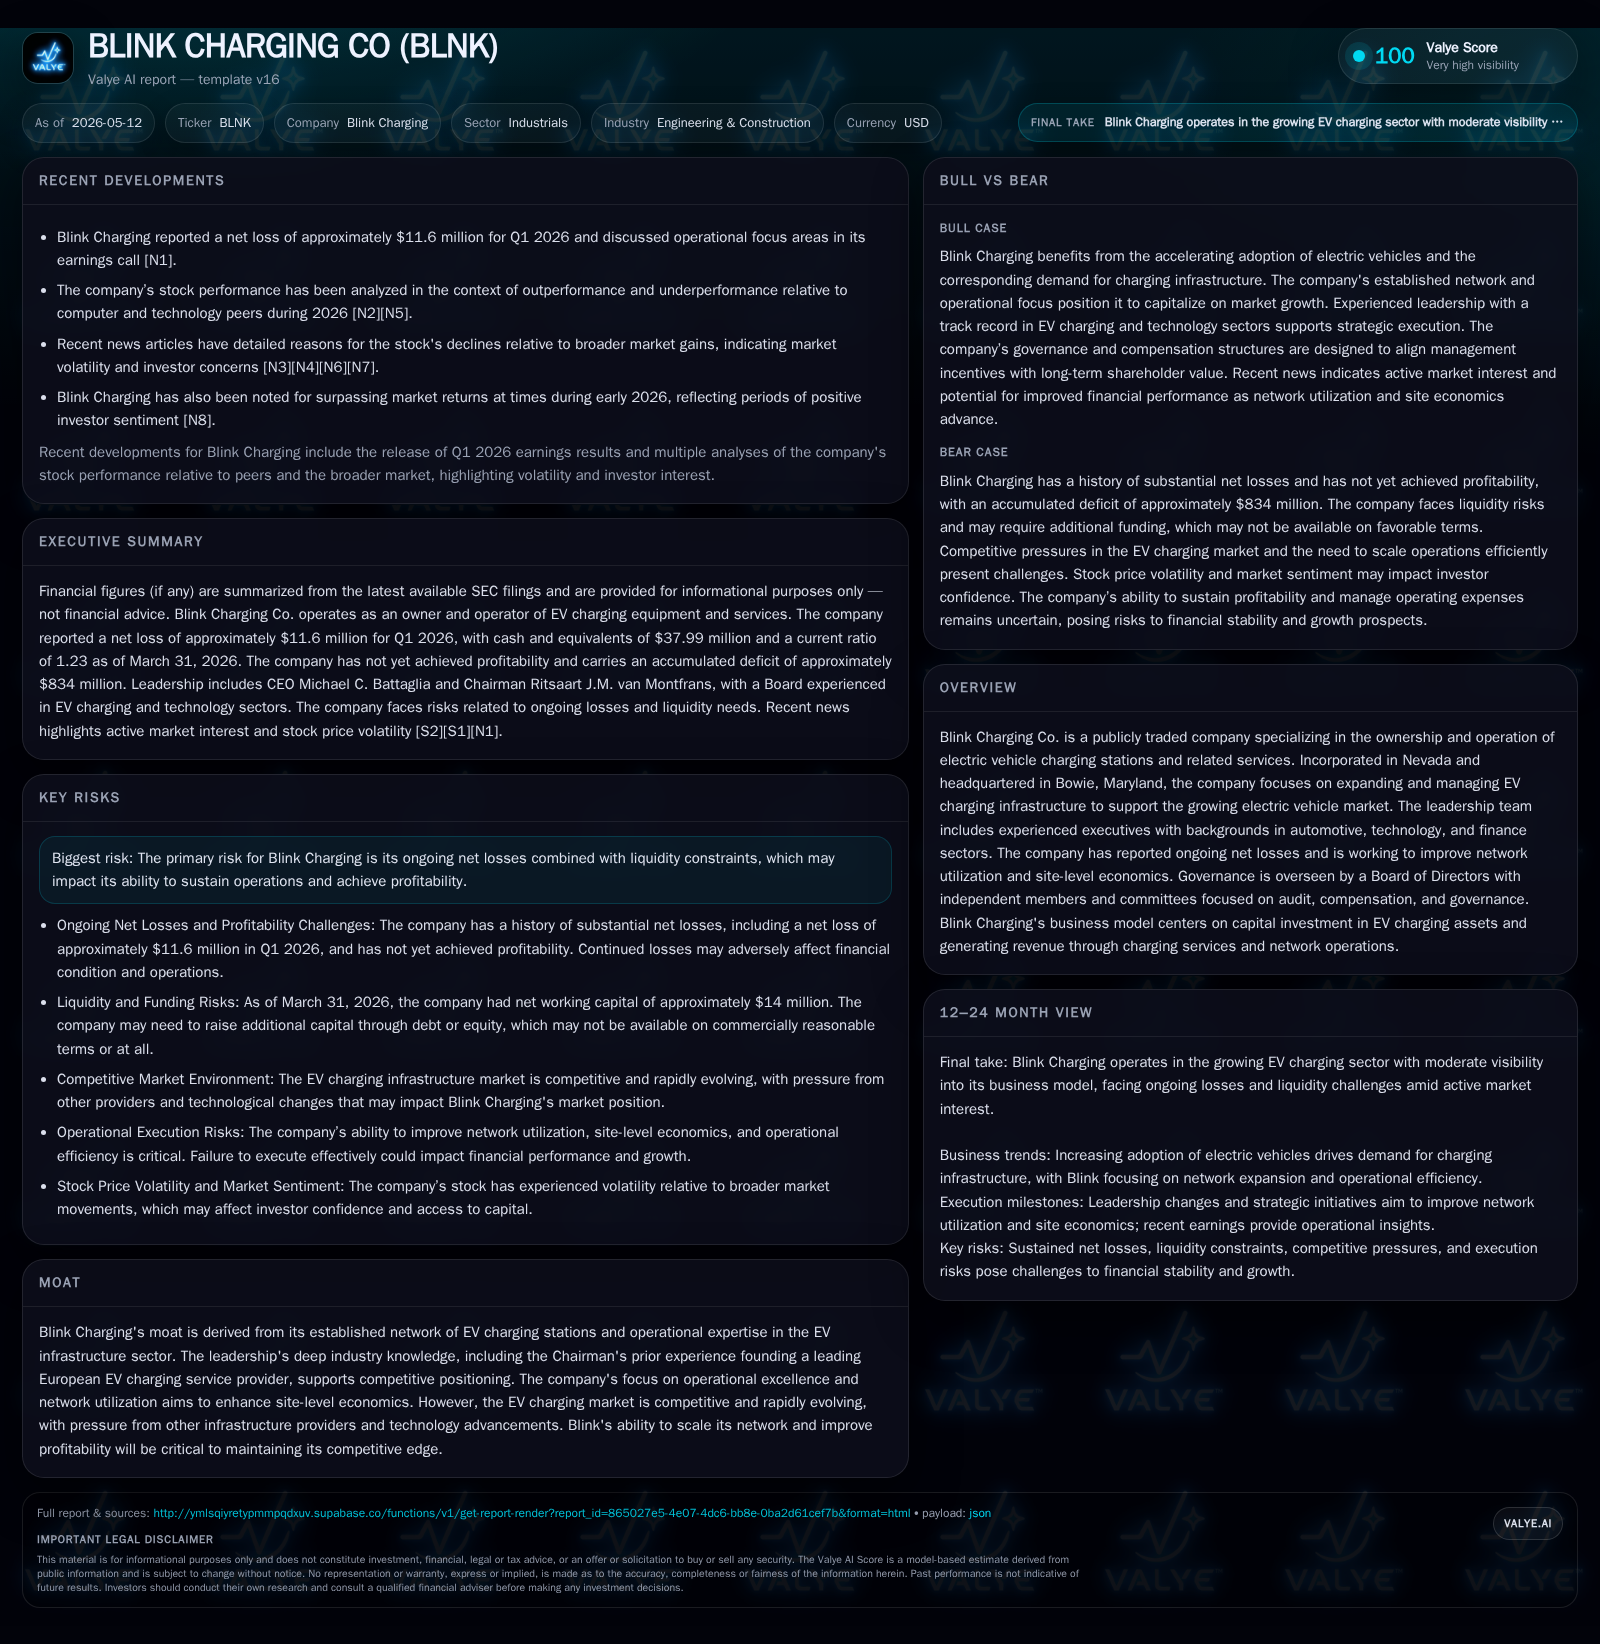
Blink Charging Co.'s latest quarterly filings reveal a net loss of $11.6 million, underscoring persistent profitability challenges. Despite this, the company is intensifying efforts to expand its EV charging network and improve site economics through enhanced operational efficiency. These moves come amid a competitive and rapidly evolving EV infrastructure market where Blink leverages its growing network and industry expertise to position for long-term growth. Liquidity remains adequate with a current ratio above 1.2, but sustained losses highlight the need for execution on growth and cost management.
Q1 2026 Operating Results and Near-Term Developments
Blink Charging Co.'s first quarter for 2026 brought persistent financial challenges along with reinforced strategic initiatives aimed at strengthening its market position in electric vehicle (EV) infrastructure. As reported in the May 11, 2026 Form 10-Q [S2], the company posted a net loss of approximately $11.6 million for the quarter ended March 31. This outcome underscores an ongoing pattern of annual and quarterly losses that Blink acknowledges as a significant operational risk [S8].
Despite these losses, Blink maintained a positive net working capital position near $14 million as of March-end, supported by a current ratio of roughly 1.23 derived from assets of $76 million against liabilities of $61.9 million [F1]. Cash and equivalents totaled about $38 million providing short-term liquidity buffers even as the company navigates high fixed costs inherent in its capital asset-heavy model [F1]. Total debt remains minimal relative to cash balances at under half a million dollars based on available best-effort data [F1].
Operational focus in Q1 continued to emphasize expanding the company's installed base of EV charging stations while applying management attention to boosting utilization rates – critical drivers for improving site-level unit economics per CEO Michael Battaglia's commentary in the annual filing and earnings call transcripts [S1][N1]. The company confirmed plans to refine network management strategies targeting higher session frequency per device and increased revenue per location [N1], reflecting an active pursuit of scaling operational efficiency during competitive pressures.
Blink Charging’s Business Model: Capturing Value from EV Infrastructure
Blink generates revenues primarily through ownership and operation of EV charging equipment concentrated on public and private locations, including retail properties, commercial parking areas, fleets, and transit hubs [S1]. The company's model is rooted in capital investing upfront in hardware installation followed by recurring service fees aggregated from charging usage along with network management offerings. This blend yields revenue driven by volume (charging sessions), pricing (retail rate-setting over cost recovery), and mix (fleet vs consumer usage patterns) dynamics.
Strategically, Blink benefits from an entrenched network that supports switching costs for customers relying on consistent service availability across multiple points of use [S1]. However, the asset-heavy approach results in high fixed operating expenses requiring careful scaling of utilization rates to approach profitable thresholds – a central challenge reflected in ongoing net losses [S8]. Leadership stresses operational excellence programs designed to improve throughput per station while balancing deployment pace to avoid underutilized assets eroding site-level returns [S1].
Customer segments vary from property owners incentivized by value-add amenity offerings to fleet operators requiring reliable access for electrified vehicles. Blink’s capacity to tailor solutions to these groups impacts retention and wallet share potential. The network-effect advantage accrues as coverage density supports user convenience but must be carefully balanced against competitive overlaps given increasing market fragmentation.
Industry Dynamics: Competition, Pricing, and Regulatory Drivers
The market environment for EV charging infrastructure is characterized by accelerating demand due to mandated emissions reductions combined with growing consumer adoption trends toward electric transportation. Government incentives such as tax credits, grants, and subsidies bolster capital spending appetite among property owners seeking infrastructure upgrades [S1]. Regulatory frameworks supporting standardized interoperability also influence deployment strategies.
Competition is intense with major utilities, energy companies, automotive OEM-backed networks, and technology startups all vying for share. Pricing power varies locally – retailers often dictate pricing aligned with utility rates plus margin while larger commercial clients negotiate contracts with volume discounts impacting average realizations. The commoditization risk in charging hardware heightens pressure on service differentiation through uptime reliability, payment integration technology, and customer support quality.
Blink’s moat derives from operational expertise accumulated under leadership veteran Chairman who previously founded a European EV charging service provider alongside extensive experience among executive ranks [S1]. Maintaining this edge depends on technology upgrades emphasizing faster charge speeds alongside data analytics capabilities enhancing usage insights.
Supply chain constraints affecting charger components intermittently limit rapid rollout capabilities industry-wide; Blink has likewise noted timing adjustments but continues focused on targeted expansion rather than indiscriminate growth to optimize asset turnover ratios.
Pathways for Growth: Network Scaling and Utilization Enhancement
Growth strategy highlights center on geographically measured expansion adding strategically located sites that complement existing clusters enabling seamless driver experience [S2][N1]. Partnership deals with property managers or fleet operators drive incremental installations leveraging shared marketing channels as well as integrated billing solutions.
Utilization improvements constitute another lever — boosting session frequency encompasses marketing campaigns promoting EV adoption within colocated communities plus operational refinements reducing downtime through predictive maintenance powered by network monitoring systems. Revenue per station enhancement aligns with upselling higher-powered chargers or premium subscription models granting faster service options.
Key performance indicators include number of active devices deployed globally, sessions per device per month, average revenue per session, churn rates among platform customers, backlog volume of contracted installations pending completion, and technological upgrade deployment timelines [N1][S2].
Q1 2026's $11.6 million loss reflects elevated operating expenses partly tied to expansion investments combined with lower-than-required site utilization levels impeding fixed cost absorption [S2]. The accumulated deficit surpassing $834 million at March end highlights cumulative earnings pressure faced over multiple years.
Liquidity appears sufficient in the near term supported by cash and equivalents of approximately $38 million and a current ratio of 1.23 as of March 31, 2026, providing buffers against short-term obligations [F1]. Total debt remains minimal relative to cash balances, indicating limited leverage and some balance sheet flexibility, though recurring losses necessitate continued external funding sources for operational sustenance [F1][S2].
Competition intensifies the risk profile where aggressive pricing or rapid technological innovations could erode Blink's market share unless it adapts swiftly. Execution risks around partnership deals failing to convert into meaningful bookings or increases in deployment costs disrupting project economics remain material concerns.
Further risk considerations include regulatory shifts potentially altering subsidy frameworks or introducing technical compliance burdens requiring incremental investments without guaranteed return offset.
Upcoming Catalysts and Execution Milestones
Investors should monitor key upcoming points including any formal updates on financial guidance reflecting impact from accelerated scaling initiatives or cost management outcomes following Q1 disclosures [N1][S3]. New contract announcements or pilot partnerships indicative of expanded channel access will serve as leading signals confirming commercial traction beyond installed base figures.
Tracking usage improvement metrics such as growth in average sessions per station monthly or improvements in revenue per user as communicated in subsequent earnings calls would provide tangible markers validating operational strategy effectiveness [N1]. Deployment cadence adjustments responsive to supply chain conditions or regulatory developments also warrant close attention.
Additionally, transparency around cash flow trajectory including potential refinancing or equity raises will offer critical insight into sustainability outlook for ongoing corporate operations [F1][S7].
Financial Overview: Latest Snapshot of Cash and Capital Structure
Latest financial snapshot
| Metric | Value | Period |
|---|---|---|
| Cash & equivalents | $38mm | |
| 2026-03-31 | ||
| Current assets | $76mm | |
| 2026-03-31 | ||
| Current liabilities | $62mm | |
| 2026-03-31 | ||
| Current ratio | 1.23x | |
| 2026-03-31 |
Source: SEC companyfacts cache [F1].
| Metric | Amount (USD Millions) | As of Date |
|---|---|---|
| Cash & Equivalents | 37.99 | |
| 2026-03-31 | ||
| Current Assets | 76.08 | |
| 2026-03-31 | ||
| Current Liabilities | 61.87 | |
| 2026-03-31 | ||
| Total Debt | 0.42 | ~2014-09-30 |
This snapshot underscores Blink’s moderate liquidity position supported primarily by cash reserves relative to short-term obligations resulting in a current ratio above one. The nominal total debt figure indicates minimal leverage allowing some flexibility although recurring losses impair retained earnings accumulation thereby necessitating continued external funding sources for operational sustenance [F1].
Overall cash conversion remains challenged given negative income trends; however, effective growth execution by improving asset turnover rates could progressively alleviate pressure over time.
This analysis is based solely on publicly available SEC filings up to May 12, 2026, supplemented with applicable news transcripts. It does not constitute investment advice.
Disclaimer: This is research-only, informational analysis and not investment advice. It may include AI-generated interpretation and general industry context. Always verify important details using primary sources.
Comments