
Bank of Hawaii Corp Faces Margin Pressures as Fee Income Softens in Q1 2026
Q1 results reveal earnings miss driven by fee income decline and rising expenses, spotlighting short-term margin challenges despite the company’s strong regional footprint.
Bank of Hawaii reported a first-quarter 2026 earnings miss due to softer fee income and escalating operating expenses, as detailed in its latest 10-Q. While the bank maintains a robust local franchise anchored by its extensive branch network and deep market expertise across Hawai’i and Pacific Islands, near-term profitability faces headwinds from competitive pressures and regulatory cost increases. Growth remains tied to the region’s tourism-driven economy and real estate cycles, with capital adequacy staying solid but margin expansion constrained. Investors should monitor upcoming quarterly fee income trends, expense control efforts, and loan portfolio quality metrics for signs of sustainable recovery.
Q1 2026 Operating Update and Its Implications
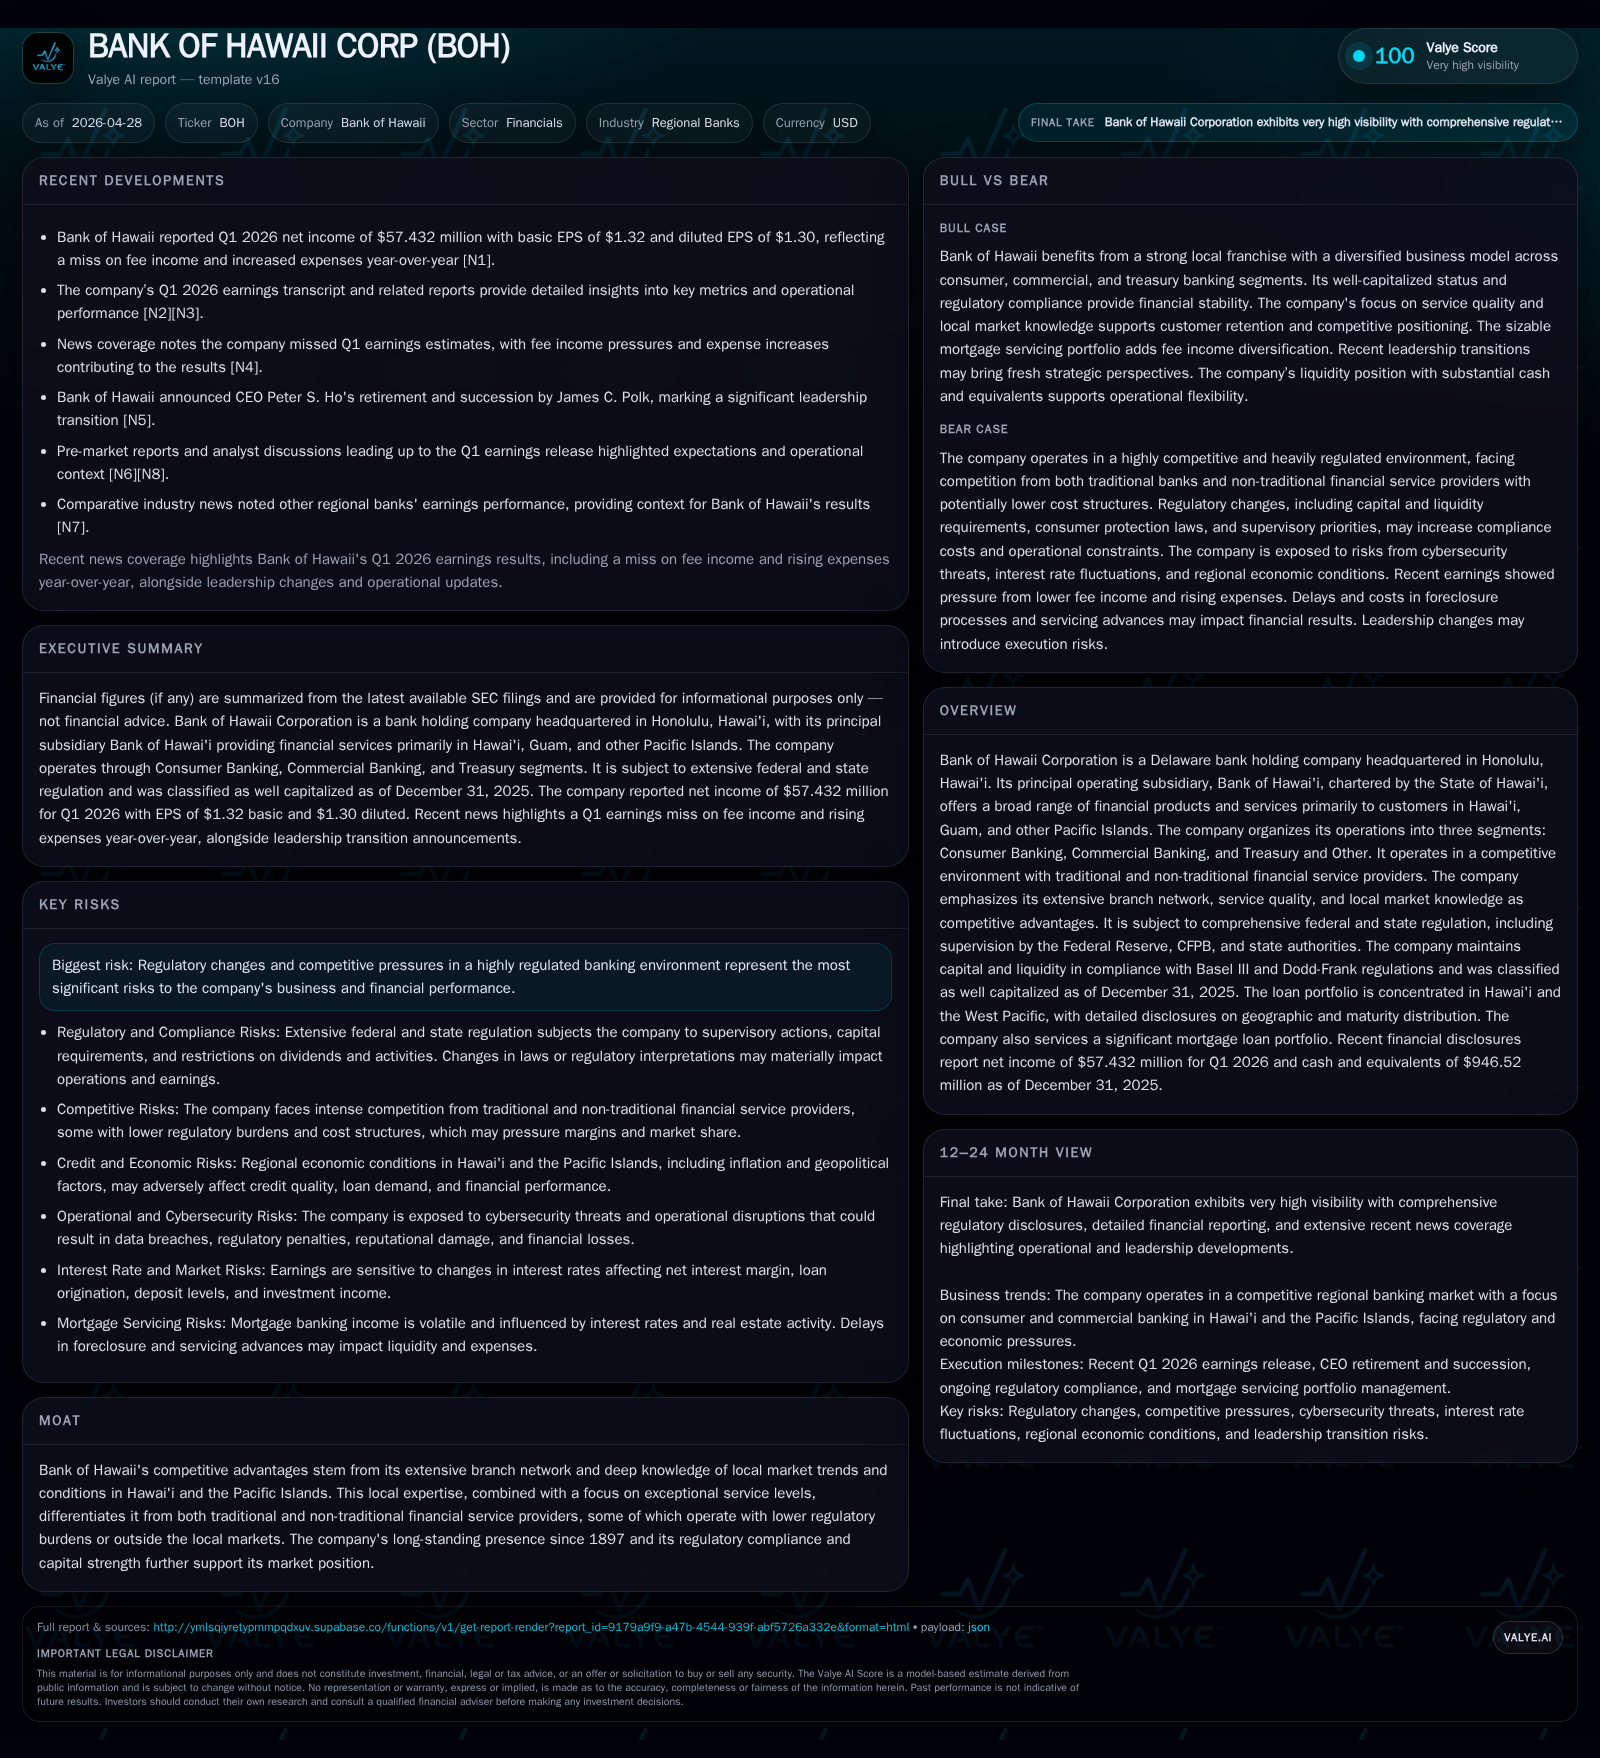
Bank of Hawaii Corporation (BOH) disclosed its financial performance for the first quarter ended March 31, 2026, in its latest Form 10-Q filed April 27, 2026 [S2]. The quarter revealed an earnings shortfall relative to expectations primarily caused by a notable reduction in fee income coupled with growing operating expenses. Market commentary following the earnings release also underscored these margin pressures [N1][N3].
Fee income softness appears tied to cyclical demand fluctuations in noninterest revenue sources such as service charges on deposit accounts and transactional fees—areas susceptible to variations in consumer spending patterns influenced by tourism and local economic activity. Concurrently, operating costs rose year-over-year amid investments in compliance infrastructure including cybersecurity enhancements mandated by evolving federal guidelines noted in prior disclosures [S1]. This dynamic exerted compression on net interest margins already challenged by competitive deposit pricing.
Importantly, despite this near-term setback, Bank of Hawaii's sound balance sheet—with a reported cash-and-equivalents base nearing $947 million as of December 31, 2025 [F1]—and prudent debt positioning cushion liquidity risk. The net-debt negative stance evidences financial flexibility supporting operations during transitional periods.
Business Model Overview: Local Market Focus and Diverse Segments
BOH is a Delaware bank holding company centered around its primary subsidiary licensed under Hawai'i state charter since 1897 [S1]. Its franchise serves customers chiefly within Hawai'i proper but extends into Guam and other Pacific Islands—a geostrategic footprint emphasizing localized banking products tailored for regional economies.
Revenue generation spans three main operational segments: Consumer Banking, Commercial Banking, and Treasury & Other services [S1]. Consumer Banking focuses on deposits alongside residential mortgage lending; Commercial Banking encompasses commercial mortgages, industrial loans, construction financing, and lease financing; Treasury & Other aggregates asset-liability management plus ancillary treasury activities.
The company's loan portfolio is notably concentrated in real estate-secured instruments. As of December 31, 2025, residential mortgages comprised roughly $4.8 billion or about one-third of total loans ($14.1 billion), while commercial mortgages accounted for nearly $4.2 billion or 30% [S17]. Geographic distribution remains heavily Hawai’i-centric (~93% of total loans), underscoring concentrated regional exposure that simultaneously delivers local specialization advantages but limits diversification [S17].
Fee income supplements net interest margins but has shown volatility tied to economic cycles impacting transaction volumes and account-related services.
Competitive Position within Hawai’i and Pacific Islands Banking
Bank of Hawaii's moat fundamentally derives from its entrenched local market knowledge cultivated over more than a century along with an extensive branch network that physically anchors customer relationships where digital penetration remains moderate relative to mainland peers [S1]. This combination fosters strong customer loyalty especially in community-driven markets exhibiting “ohana” cultural values that influence preference for local institutions.
However, the competitive landscape includes several dimensions. Traditional competitors encompass regional banks operating in overlapping Pacific territories plus larger mainland banks selectively active through digital channels or correspondent relationships. Meanwhile, non-traditional fintech entrants apply technology-enabled platforms often exempt from bank regulatory overheads delivering certain convenience or pricing advantages. BOH faces cost structures anchored by regulatory compliance distinct from these less regulated counterparts [S6].
Its geographic limitation curtails large-scale expansion potential beyond core markets; while concentration affords market insight it elevates sensitivity to localized economic volatility particularly tourism sector downturns or real estate cycles that dominate Hawai’i's economy [S18].
Drivers Supporting Growth and Margin Expansion
Key growth drivers revolve around favorable cyclical catalysts intrinsic to the regional economy:
- Recovery trajectory in tourism—the primary economic engine influencing consumer spending vitality affecting retail deposit activity and wealth management engagement.
- Real estate market conditions affecting both residential mortgage originations and commercial property lending demand.
- Expansion in commercial lending fueled by government projects, military installations operational needs, construction activity servicing infrastructural developments.
- Operational improvements via technological upgrades enhancing customer experience while aiming to retain service quality amidst cost discipline efforts highlighted recently [N2][S3].
- New product initiatives targeting fee-based revenue streams offer scope for offsetting episodic declines observed recently.
Successful cross-selling across business segments leveraging comprehensive client insights remains a potential margin lever growing wallet share per customer within the localized ecosystem.
Constraints: Expense Trends, Fee Income Headwinds, and Regulatory Risks
Notwithstanding growth vectors, BOH faces significant constraints suppressing near-to-mid term margin improvement:
- Operating expenses have risen primarily due to expanded regulatory compliance costs including cyber-risk management consistent with federal banking agency guidance issued during recent years [S1][S2]. This trend pressures administrative overhead ratios which are challenging to compress given scale constraints.
- Fee income streams experienced contraction reflective not only of regional economic slowdowns but also intensified competition eroding pricing power [S2][N1].
- Regulatory scrutiny extends beyond capital adequacy into consumer protection enforcement (CFPB jurisdiction persists despite shifts toward deregulation) driving elevated examination intensity contributing to potential remedial expenditures or reputational risks [S20].
- Concentrated loan portfolio risks tied to real estate downturns could manifest as asset-quality deterioration impacting earnings stability during prolonged economic stress episodes with limited geographic mitigants [S18].
Collectively these dynamics require vigilant management balancing expense controls without impairing service levels that uphold competitiveness in culturally nuanced markets.
Upcoming Milestones and Investor Watchpoints
Looking ahead through mid-2026 investors should focus on several operational KPIs and strategic execution indicators:
- Stabilization or rebound signals in fee income components such as service charges and transaction-related revenues driven by normalized tourism visits post-pandemic volatility.
- Effectiveness of ongoing expense management initiatives including technology investments targeted at achieving long-term cost efficiencies without sacrificing frontline customer support.
- Loan portfolio quality trends especially delinquencies or charge-offs within commercial mortgage categories sensitive to market valuation shifts.
- Regulatory developments that could alter capital distribution capacity directly influencing dividend policy or share repurchase programs.[S4]
- Management commentary updates on net interest margin trajectory amid evolving interest rate environment influencing deposit costs versus loan yields.
These metrics will provide forward hints regarding margin recovery pacing amid structural headwinds.
Summary Financial Snapshot: Capital, Liquidity, and Earnings Context
BOH exhibits a conservative financial profile maintaining strong liquidity buffers with cash & equivalents approximately $947 million as measured at year-end 2025 [F1]. The net cash positive status (net debt of approximately -$388 million as of March 31, 2026) reflects prudent balance-sheet stewardship under Basel III frameworks enforced via Dodd-Frank compliance monitored closely by regulators [F1][S12].
While precise Q1 earnings figures are not explicitly stated here beyond qualitative assessments relayed in SEC filings [S2], the acknowledged earnings miss due to fee income softness paired with increased expense load signals caution on margin upside visibility near term without swift operational turnaround measures. Capital adequacy ratios remain aligned with ‘well-capitalized’ thresholds reducing immediate solvency concerns thereby underpinning resilience even through episodic profit pressures.
This analysis is grounded strictly in disclosed filings through April 27, 2026 ([S2]) supplemented by prior annual Form 10-K descriptors ([S1]) and validated numeric data ([F1]). Observations reflect current operating realities without speculative extrapolation beyond evidence. No investment advice or price guidance is provided herein.
Disclaimer: This is research-only, informational analysis and not investment advice. It may include AI-generated interpretation and general industry context. Always verify important details using primary sources.
Comments