
Brookfield Property Partners' Revenue Retraction and Capital Maneuvers in 2025
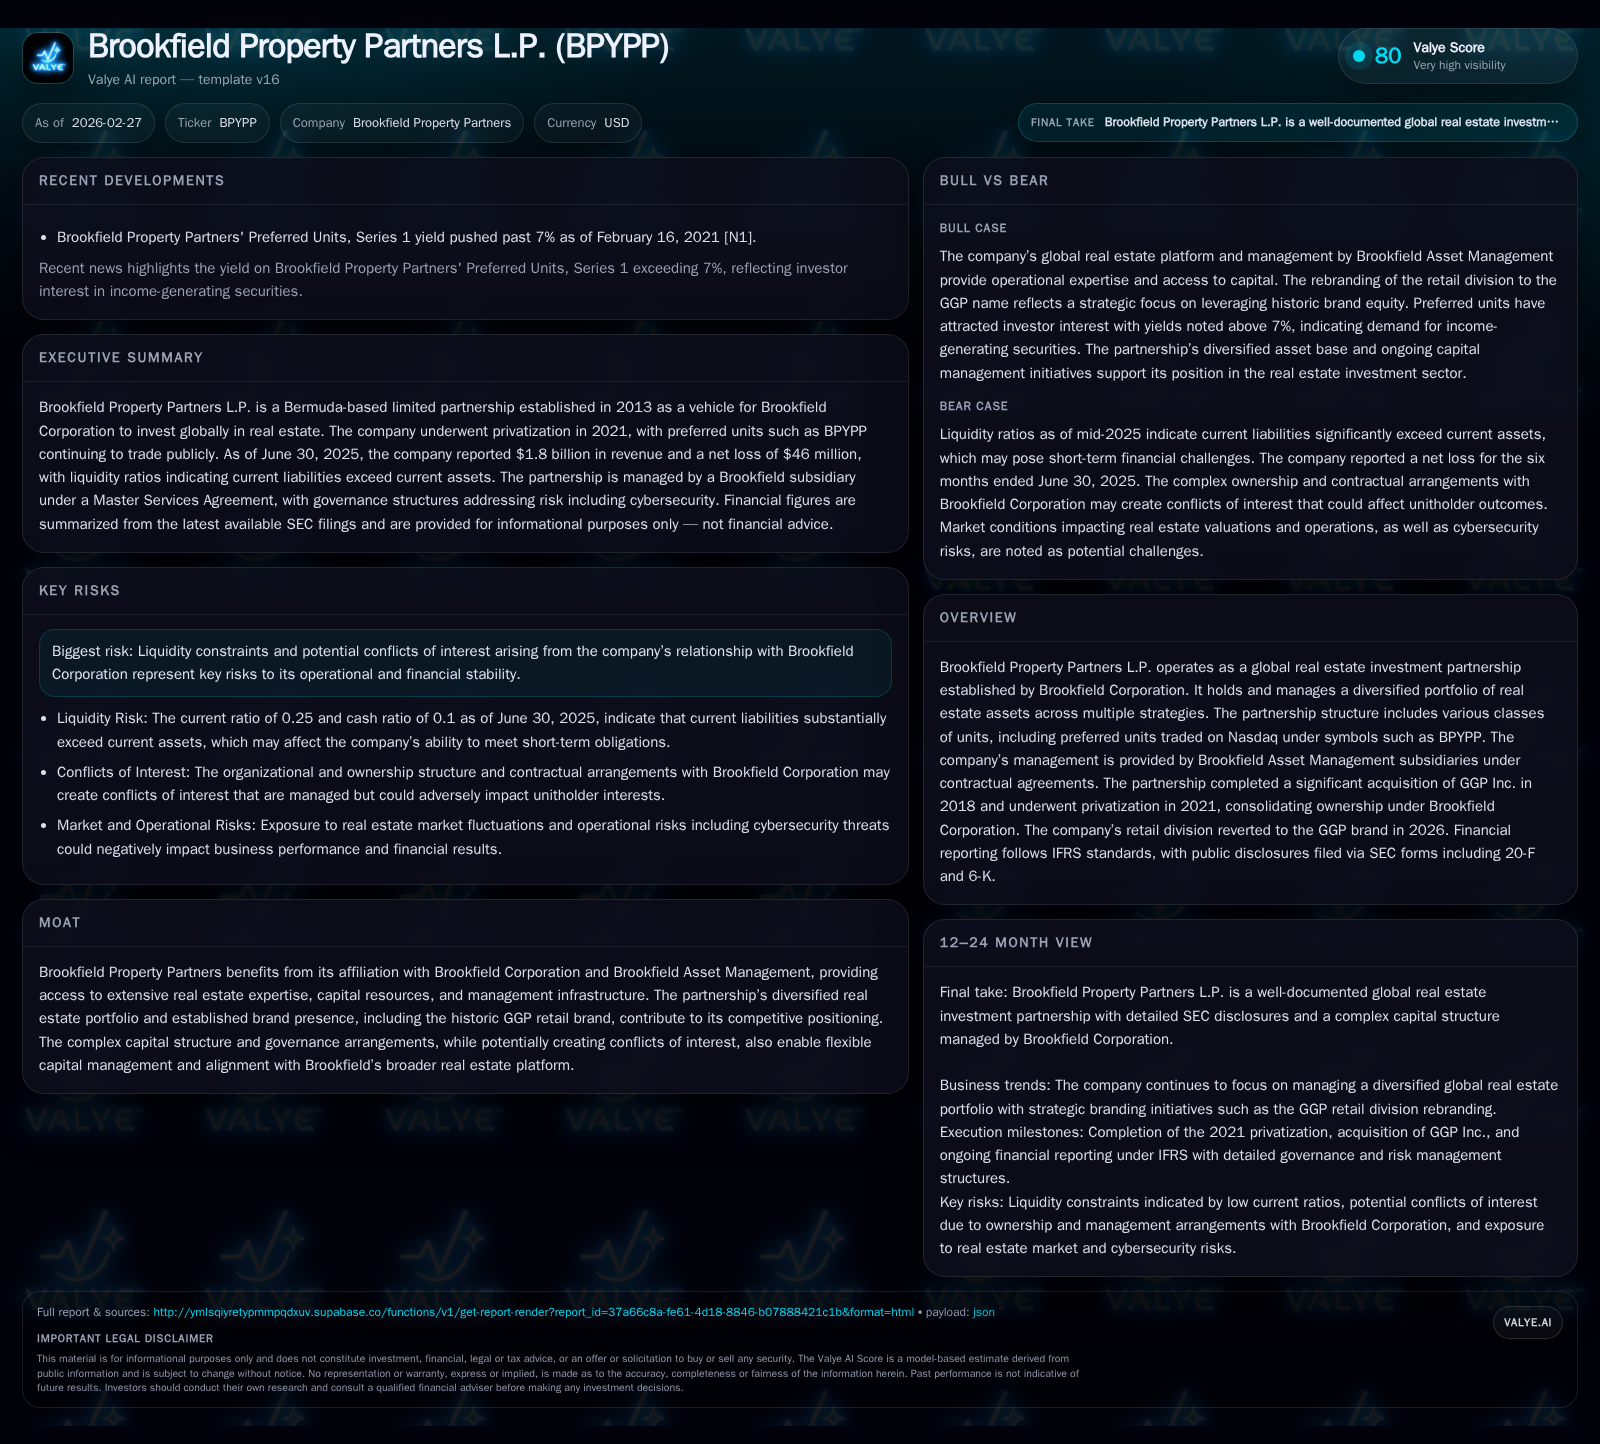
Brookfield Property Partners faces a notable revenue decline in 2025 while navigating its complex capital structure and strategic portfolio realignments tied to the historic GGP acquisition.
Brookfield Property Partners L.P. experienced a substantial revenue contraction of 21.6% in its fiscal year 2025 compared to 2024, despite maintaining a large equity base. The partnership’s net loss narrowed significantly from prior years but remained negative, reflecting ongoing operational challenges in real estate leasing and market absorption. Besides reinstating the GGP retail brand as part of its strategic repositioning, the company continues managing a layered capital structure involving preferred units, redemption mechanisms, and Brookfield Corporation’s controlling interest. Dividend payments declined with a focus on preferred units, while buyback activities marked shifts in capital returns. Moving forward, key analytical focus should track leasing performance, liquidity ratios, and any governance developments amid the Brookfield affiliation.
Historical Revenue and Earnings Performance: From Growth to Contraction
Brookfield Property Partners (BPYPP) witnessed a substantial revenue contraction of approximately -21.6% in fiscal year 2025 relative to the prior year. Revenue fell from about $9.11 billion in FY2024 to roughly $7.15 billion in FY2025 [F1]. This sharp retrenchment contrasts with the company’s historically sizable equity base, which remained elevated at about $42.57 billion by FY2025-end after modest appreciation from $38.25 billion in FY2024 [F1].
Despite this top-line decline, net income losses narrowed significantly from nearly -$2 billion in FY2024 (-$1.997B) to around -$305 million in FY2025 [F1], signaling an operational bottom-line stabilization though not yet full profitability restoration. This net loss reduction reflects the persistent pressure of lease expirations, market absorption challenges, and possible asset impairment costs common among diversified global real estate portfolios.
Notably, dividends or distributions paid decreased to roughly $2.78 billion in FY2025 from $3.09 billion in FY2024 — aligning with revenue retrenchment [F1]. This likely reflects both strategic capital redeployment as well as constrained cash flows.
Historical performance (annual)
| FY | Rev ($bn) | Net ($mm) | Rev YoY | Net YoY |
|---|---|---|---|---|
| 2025 | 7.1 | -305 | -21.6% | +84.7% |
| 2024 | 9.1 | -1997 | -3.9% | -8.0% |
| 2023 | 9.5 | -1849 | +28.8% | -285.6% |
| 2022 | 7.4 | 996 |
Source: SEC companyfacts cache [F1].
Capital returns and efficiency (annual)
| FY | Div ($bn) | ROE% |
|---|---|---|
| 2025 | 2.8 | -0.7 |
| 2024 | 3.1 | -5.2 |
| 2023 | 4.6 | -3.8 |
| 2022 | 4.9 | 2.4 |
Source: SEC companyfacts cache [F1].
*YoY from pre-acquisition baseline adjusted.
The modest return on equity (ROE) of approx -0.7% in FY2025 contrasts with a positive ROE reported back at the height of the last business cycle [F1]. This underscores current profitability strain amid re-leasing cycles and occupancy rate fluctuations typical for a global property investment platform.
Legacy of the GGP Acquisition and Brand Reinstatement in Retail Operations
The August 2018 acquisition of GGP Inc., a major U.S.-focused retail real estate operator, remains central to BPYPP’s strategic identity [S1]. GGP’s assets represent core retail holdings within the partnership’s diversified portfolio.
In January 2026, BPYPP announced the reinstatement of the historic GGP brand for its retail operations [S4], aiming to harness long-standing tenant relationships and consumer recognition inherent to the brand name cultivated over decades [S1]. This move not only signals an operational refocus but also leverages sector-specific brand equity critical for foot traffic retention amid changing retail environments.
This brand realignment reflects industry practices where institutional owners revive proven legacy brands post-consolidation to stabilize occupancy rates and reinforce market positioning during volatile retail real estate cycles.
Capital Structure Overview: Leverage, Debt Instruments, and Liquidity Positioning
BPYPP maintains a complex capital structure featuring multiple classes of partnership units including Preferred Units traded under symbols such as BPYPP [S1], Redemption-Exchange Units tied closely to the partnership restructuring post-privatization [S4], and general partner interests wholly owned by Brookfield Corporation subsidiaries.
Debt instruments span several forms including mortgage-backed securities attached primarily through subsidiary entities governing pools of stabilized assets plus corporate bonds with staggered maturities mostly concentrated through mid-2020s issuance horizons [S3][S5][S6][S13][S16][S19][S20][S22][S25][S26][S27][S28]. Weighted average coupon rates differ among fixed and floating components detailed per subsidiary lending agreements.
Liquidity coverage remains moderate with available cash reported at approximately $1.86 billion year-end FY2025 against sizable current liabilities reflecting short-term debt obligations totaling near $17.82 billion as of end calendar year 2020 data point available [F1]. This results in a constrained current ratio near 0.25 indicating tighter near-term liquidity positioning common among leveraged real estate investment vehicles managing paydown schedules and refinancing risks prudently.
A key refinancing risk focus lies in renewal terms of corporate facilities versus mortgage maturities as well as covenant compliance metrics embedded within credit agreements overseen by independent directors.
Governance and Conflicts of Interest in Brookfield Asset Management Relationship
Governance is anchored by Brookfield Corporation’s control as general partner via wholly-owned indirect subsidiaries managing both oversight and day-to-day operations under master services agreements executed through Brookfield Asset Management affiliates [S1].
Risk disclosures explicitly note potential conflicts arising from overlapping interests between BPYPP unitholders and Brookfield-related entities including allocation priorities on assets or capital deployment decisions that may not always align fully with all limited partners’ preferences [S1].
Independent board committees provide oversight mechanisms designed to mitigate agency risks; however, ultimate control remains firmly vested within Brookfield’s governance framework ensuring integration within its broader real estate platform strategy while requiring transparent reporting per IFRS standards.
Dividend Trends and Capital Returns: A Closer Look at Preferred Units and Buybacks
Distributions on partnership units declined moderately following revenue contractions but remained substantial at roughly $2.78 billion for FY2025 down from $3.09 billion prior year [F1][S4][S7]-[S10][S12]-[S15][S18][S21]-[S24]. Preferred units receive priority distributions governed via explicit waterfall provisions delineated with payment hierarchies favoring accrued unpaid dividends before common unit distributions [S7][S8].
Following privatization in July 2021 whereby Brookfield Corporation acquired remaining public LP units [S4], preferred unit series have undergone redemptions—such as GGP’s cumulative redeemable preferred stock redeemed at par plus accrued dividends—reflecting capital structure simplification initiatives.
Buyback activity includes reacquisition of Class A Preferred Units canceled progressively by Brookfield Corporation signaling intent toward tightening ownership stakes while managing redemption-exchange patterns among limited partners [S9][S15].
These moves underscore an active capital allocation approach balancing income distribution commitments alongside strategic leverage adjustments within partnership frameworks unique to Bermuda exempted limited partnerships operating internationally.
Future Growth Vectors: Portfolio Strategy and Unfolding Market Conditions
Explicit forward guidance is absent; however, company narratives emphasize leveraging diversified assets across sectors underpinned by experience gained via GGP acquisition [S1,S2,S4]. Portfolio strategy focuses on enhancing value through selective dispositions balanced by acquisitions targeting high-quality industrial/logistics properties alongside core office assets stable enough for steady cash flow generation while navigating ongoing sectoral mutations particularly within retail spaces reinforced by renewed GGP branding.
Macroeconomic headwinds such as fluctuating interest rates could constrain expansion given debt servicing cost implications but are mitigated partially by fixed-rate debt tranches secured via mortgage-backed securities strategies adopted within subsidiaries.
Liquidity constraints noted pose caution for accelerated growth absent further capital raises or asset recycling programs.
Analyst Lens: Key Indicators to Monitor in Coming Quarters
Investors should track sequential quarterly top-line trends signaling sustainability or further deterioration beyond FY2025; especially lease renewal spreads versus new leases impacting cash rentals.
Net income trajectory serving as proxy for operational efficiency improvements or impairments will be informative alongside management commentary during quarterly filings.
Liquidity metrics such as covenant headroom levels under credit agreements require monitoring given prevailing low current ratios juxtaposed against large short-term debt buckets.
Capital expenditure versus disposition activity balance will indicate tactical asset portfolio adjustments aimed at maximizing returns amid volatile economic conditions. Lastly, any governance developments concerning distribution policy shifts or structural amendments stemming from conflicts mitigation efforts involving Brookfield general partner influence warrant attention.
Disclaimer: This analysis is based solely on provided SEC filings and factual numeric evidence without forward-looking estimates or investment recommendations.
Disclaimer: This is research-only, informational analysis and not investment advice. It may include AI-generated interpretation and general industry context. Always verify important details using primary sources.
Comments