
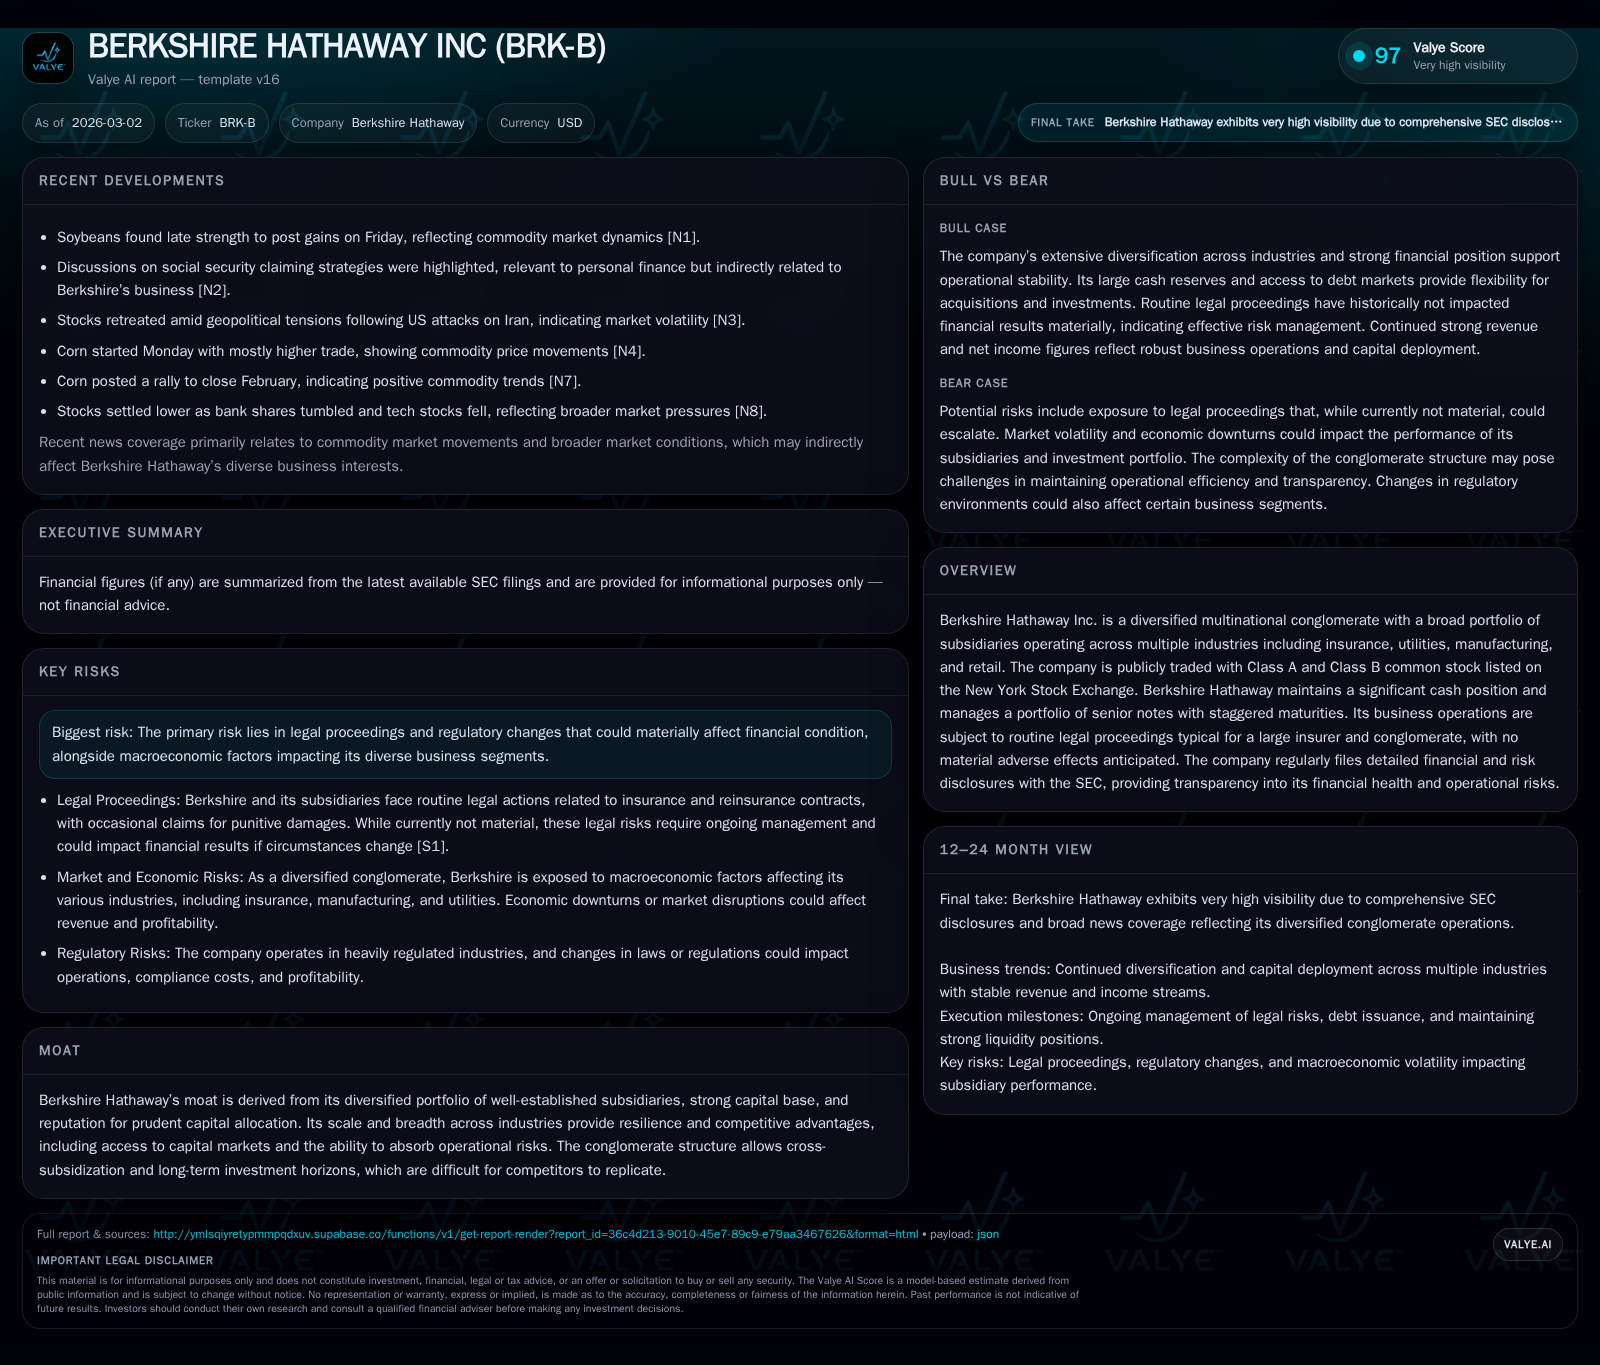
Berkshire Hathaway's Financial Pulse: Growth Patterns, Capital Choices, and Future Horizons
Berkshire Hathaway’s scale, capital discipline, and diversification underpin resilience despite recent earnings volatility and evolving leadership.
Berkshire Hathaway Inc., a diversified multinational conglomerate, reported essentially flat revenues at $371.4 billion in 2025 with net income declining nearly 25% year-over-year to $66.9 billion. Operating cash flow improved sharply by over 50%, supporting robust free cash flow of approximately $25 billion amid moderate capex increase. The company has significantly pared back share repurchases from prior peak levels and maintains a strategic multi-tranche senior note issuance profile through 2040 to manage its capital structure efficiently. While routine litigation and regulatory changes remain operational risks, Berkshire’s broad portfolio and capital strength sustain its moat and growth runway, even as leadership transitions unfold.
Berkshire Hathaway at a Glance: Diversification and Capital Strength
Historical performance (annual)
| FY | Rev ($bn) | Net ($bn) | CFO ($bn) | Capex ($bn) | Rev YoY | Net YoY |
|---|---|---|---|---|---|---|
| 2025 | 371.4 | 67.0 | 46.0 | 20.9 | +0.0% | -24.8% |
| 2024 | 371.4 | 89.0 | 30.6 | 19.0 | +1.9% | -7.5% |
| 2023 | 364.5 | 96.2 | 49.2 | 19.4 | +20.7% | +521.7% |
| 2022 | 302.1 | -22.8 | 37.2 | 15.5 |
Source: SEC companyfacts cache [F1].
Capital returns and efficiency (annual)
| FY | Buybacks ($bn) | FCF ($bn) | ROE% |
|---|---|---|---|
| 2025 | 2.9 | 25.0 | 9.3 |
| 2024 | 2.9 | 11.6 | 13.7 |
| 2023 | 9.2 | 29.8 | 17.1 |
| 2022 | 7.9 | 21.8 | -4.8 |
Source: SEC companyfacts cache [F1].
Berkshire Hathaway stands as one of the most expansive diversified conglomerates globally, operating a wide array of subsidiaries spanning key industries such as insurance services, utilities (through Berkshire Hathaway Energy), manufacturing, and retail [S1][S7][F1]. This breadth provides the firm with a formidable moat centered on cross-industry scale advantages and access to multiple capital sources.
Financially, Berkshire's equity base swelled significantly in recent years, surpassing $717 billion at the close of fiscal year 2025 [F1]. This capital heft empowers Berkshire not only to absorb cyclical volatility but also to pursue long-term investments unfettered by short-term market pressures—a hallmark of its competitive edge.
Tracking Recent Revenue and Earnings Trajectories
From an income statement perspective, Berkshire’s revenue plateaued around $371.4 billion in FY2025 compared with an equally substantial $371.4 billion in FY2024, reflecting negligible top-line growth (+0%) [F1]. This stagnation follows faster expansion the prior years when revenue jumped from approximately $302 billion in FY2022 to above $364 billion in FY2023.
Despite stable revenues, net income experienced marked volatility—declining approximately 24.8% year-over-year to $66.9 billion in FY2025 after higher levels of nearly $89 billion in FY2024 [F1]. Earlier periods had seen extreme swings including a loss of over $22 billion in FY2022.
Such fluctuations primarily derive from Berkshire's insurance segment underwriting results coupled with investment portfolio valuations heavily influenced by market cycles rather than steady recurring streams alone [S3]. Practitioners closely monitor recurring income components within earnings analysis due to this variable mix.
Operational Cash Flow and Investment Spend Trends
A counterpoint to net income dips is the robust increase in operating cash flow (CFO), which jumped over 50% YoY from about $30.6 billion in FY2024 to $45.97 billion in FY2025 [F1]. This surge reflects underlying business operational strength and working capital improvements.
Simultaneously, capital expenditures increased modestly by around 10% year-over-year from roughly $18.98 billion up to around $20.9 billion [F1]. Such capex levels suggest continued investment either for capacity expansion or modernization projects consistent with maintaining Berkshire’s extensive physical asset footprint.
Subtracting capex from CFO yields free cash flow near $25 billion for FY2025—a solid figure highlighting the company's ability to internally fund acquisitions or return capital while sustaining operations [F1].
Capital Allocation Discipline: Buybacks, Dividends, and Debt Strategy
Berkshire has retreated notably from aggressive share repurchase volumes witnessed earlier this decade. Reported buybacks dropped sharply to about $2.9 billion in 2025 compared with peaks exceeding $9 billion in prior years [F1][S12][S13][S14]. This pullback likely aligns with valuation considerations or shifting priorities in allocating excess capital.
Regarding dividends, Berkshire is renowned for historically preferring reinvestment over paying dividends; details remain consistent without material changes disclosed recently [S12][S13][S14].
On the liability side, Berkshire issued multiple tranches of senior notes at predominantly low fixed coupon rates ranging between approximately 1.51% and 2.81%, maturing from 2028 through 2040 [S8][S9][S10]. These issuances underscore an active approach toward capital structure management—using long-dated debt instruments efficiently amid a fluctuating interest rate environment.
Earnings Volatility Drivers and Legal Risk Context
Earnings unpredictability stems largely from insurance underwriting performance affected by claims trends and reserve adjustments alongside variable investment income tied to financial markets [S3][S4][S5]. Such factors inject asymmetry into reported profits quarter-to-quarter or year-to-year.
Legal proceedings involving insurance contract liabilities or regulatory compliance challenges are standard for an insurer-conglomerate of Berkshire’s size [S1][S3]. While lawsuits occasionally entail claims for punitive damages or fines, these matters currently pose no material risk expected to impair financial condition materially [S16]. Nonetheless, ongoing regulatory evolution warrants vigilant monitoring.
Looking Ahead: Growth Prospects Rooted in Strategic Subsidiaries
Although explicit forward guidance remains undisclosed by management as of early 2026 [N1], Berkshire’s ecosystem spanning core insurance businesses, regulated utilities, niche manufacturing entities, and retail chains promises enduring organic growth potential assisted by rising economic activity and strategic reinvestment capabilities [S1].
Analysis suggests that while conglomerates face conglomerate discount challenges in public markets due to perceived complexity, Berkshire counters this through demonstrated prudent capital deployment and diversified earnings streams offering stability during downturns.
Imperatives to Watch: Potential Regulatory and Macroeconomic Impacts
External risks include shifts in regulatory frameworks governing insurance solvency standards or utility tariffs which could affect pricing power and capital requirements [S3][S4]. Furthermore, macroeconomic factors such as inflation dynamics or Federal Reserve monetary policy shifts directly influence funding costs via debt markets as well as investment portfolio valuations [N3].
These forces collectively underscore the need for adaptive risk management strategies even within such a sprawling corporate structure.
Valuation Considerations and Long-Term Investment Thesis
Berkshire's estimated return on equity (ROE) hovered near a respectable ~9.3% metric calculated by dividing latest net income ($66.9B) by shareholders’ equity ($717B) at fiscal year-end 2025—indicating efficient utilization of its substantial equity base [F1].
Free cash flow generation close to $25 billion supports ongoing internal funding capacity plus strategic flexibility. Unlike many peers burdened by dividend payout expectations, Berkshire’s model favors reinvestment—a significant factor offsetting typical conglomerate discounts.
In sum, Berkshire’s combination of scale-based diversification, disciplined capital allocation processes including cautious buybacks and conservative leverage management through staggered senior notes issuance create a balanced financial pulse anchored on stability yet adaptable growth pathways.
This analysis is based on publicly available filings and news transcripts as sourced without speculation or forward-looking guidance beyond documented company disclosures or established reporting frameworks. It aims solely at presenting an informed view of Berkshire Hathaway Inc.’s recent financial trends alongside contextual industry factors for internal analytical purposes.
Disclaimer: This is research-only, informational analysis and not investment advice. It may include AI-generated interpretation and general industry context. Always verify important details using primary sources.
Comments