
Bassett Furniture's Growth Rebounds After Volatile Recent Years with Mixed Q1 Performance
Bassett Furniture Industries combines a century-old brand with integrated manufacturing and retail, but faces growth and margin pressures from weather disruptions and supply chain risks.
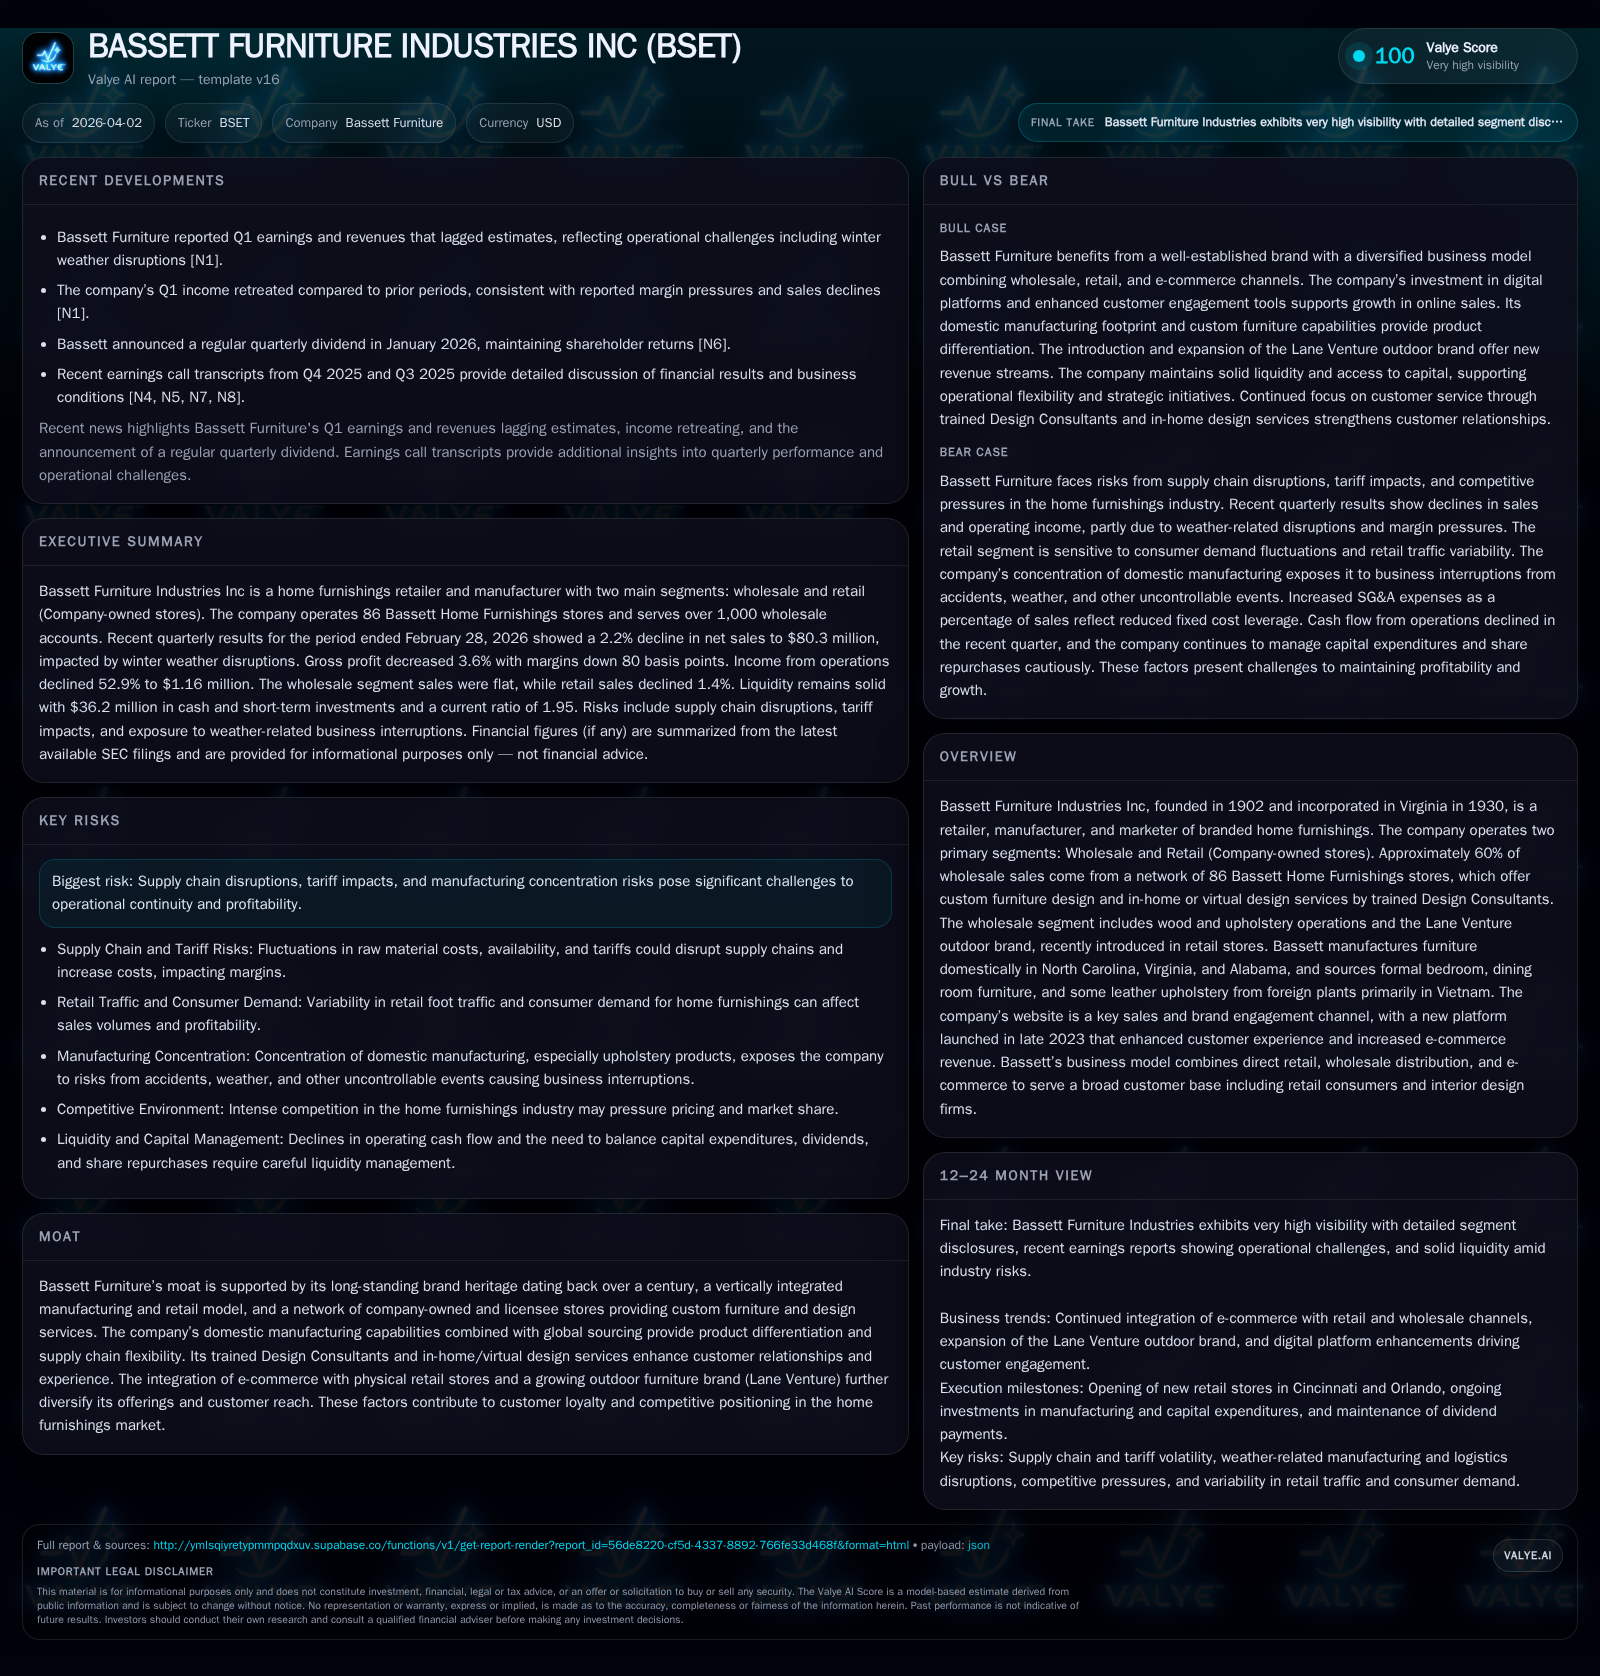
Bassett Furniture Industries Inc (BSET) has shown considerable turnaround in operating results from substantial losses in FYs 2023-24 to profitability in FY 2025. The company’s vertically integrated model, combining domestic manufacturing and a retail footprint with a growing e-commerce platform, underpins its competitive moat. However, recent Q1 2026 results reveal top-line softness and compressed margins partly due to winter weather disruptions and tariff timing complications. Liquidity remains healthy with manageable debt and ongoing share repurchases, while growth catalysts include expanded Lane Venture outdoor furniture offerings and new store openings. Risks include supply chain volatility, tariff impacts, and retail traffic uncertainty.
Company Overview
Bassett Furniture Industries Inc (BSET), founded in 1902 and incorporated in Virginia since 1930, operates as a vertically integrated home furnishings retailer, manufacturer, and marketer rooted in long-standing brand heritage. Its core strategy combines custom furniture design and domestic production capabilities alongside global sourcing — predominantly from Vietnam for formal bedroom and some leather upholstery products — allowing Bassett to tailor product mix flexibly amid supply volatility , [S19]. Approximately 60% of the wholesale segment’s revenues occur through a network of 86 Bassett Home Furnishings stores (both company-owned and licensee-operated) that provide a one-stop shopping experience enhanced by trained Design Consultants offering free in-home or virtual design services, underscoring a customer-centric moat through service differentiation , [S27]. The company has also been expanding its outdoor furniture brand Lane Venture into its retail footprint to diversify revenue streams.
Historical Performance
Bassett’s financial trajectory over recent years reflects significant volatility with a dramatic loss period during FYs 2023 (-$3.1M operating loss) and 2024 (-$16.3M operating loss) following earlier profitability in FY 2022 ($34.9M operating income) [F1]. This swing indicates episodic challenges likely related to supply disruption costs, shifting consumer demand patterns, or operational restructuring efforts.
However, the company staged a noteworthy turnaround in FY 2025 reporting operating income of $7.8M—a roughly +148% improvement—and net income of $6.1M (+163%) signaling restoration of profitability at scale after prior years’ deficits. Operating cash flow also improved significantly to $13.5M in FY 2025 versus only $4M the prior year while capital expenditures moderated from previous elevated levels consistent with investment normalization post restructuring cycles ($4.53M vs ~$5.2M prior year). Equity declined modestly but remained robust at $165.1M indicating stable capitalization amidst earnings recovery [F1].
Historical performance (annual)
| FY | Net ($mm) | CFO ($mm) | OpInc ($mm) | Capex ($mm) | Net YoY |
|---|---|---|---|---|---|
| 2025 | 6 | 13 | 8 | 5 | +162.9% |
| 2024 | -10 | 4 | -16 | 5 | -205.7% |
| 2023 | -3 | 19 | -3 | 17 | -104.9% |
| 2022 | 65 | -3 | 35 | 21 |
Source: SEC companyfacts cache [F1].
Capital returns and efficiency (annual)
| FY | Div ($mm) | Buybacks ($mm) | FCF ($mm) |
|---|---|---|---|
| 2025 | 7 | 2 | 9 |
| 2024 | 7 | 1 | -1 |
| 2023 | 6 | 4 | 1 |
| 2022 | 20 | 15 | -24 |
Source: SEC companyfacts cache [F1].
Table: Selected Annual Financial Highlights for Bassett Furniture Industries Inc (All figures USD millions) [F1]
Recent Quarterly Results
The first quarter fiscal year ending February 28, 2026 showed mixed trends amidst external headwinds including severe winter weather impacting store operations and logistics downstream resulting in a total revenue decrease of approximately -2.2% YoY [$80.34M vs prior year $82.16M] largely from the retail segment (-1.4%) complemented by a more notable decline in open market wholesale sales (-5%) despite slight shipment increases within their store network wholesale channel [+0.6%] including the burgeoning Lane Venture line which saw shipments grow +32% overall including retail integration [$52.96M wholesale] [S14], [S17], [S23].
Margins contracted materially: Gross profit margin dipped roughly by ~80 basis points overall driven by tariff timing delays on price adjustments notably reducing retail segment margin by about ~170 basis points as price increases were implemented mid-January only; wholesale margins also fell modestly chiefly due to fixed cost leverage reduction in upholstery manufacturing partially offset by pricing improvements on casegoods lines [S14], [S24], [S17]. SG&A expenses scaled slightly as a portion of sales (+70 bps), reflecting lower volume leverage effects although offset somewhat by warehouse/delivery efficiencies.
The retail business experienced operating losses reaching approximately -$1M for the quarter compared to near break-even last year attributed partially to investments associated with new store pre-opening expenditures ($95K incurred for upcoming Cincinnati & Orlando locations), which traditionally result in early-stage negative contribution coupled with inherent lag times until break-even is reached post-opening (a few months). These dynamics highlight typical industry unit economics tied to custom order build lead times (>30 days average delivery lag) delaying revenue recognition beyond order intake periods plus upfront costs for staffing/training/store setup [S26], [S24]. Wholesale segment income from operations slipped modestly (-3%) to about $8.4 million.
Cash flow deteriorated notably in Q1 with operating activities consuming $5.47 million compared to flat operation cash flow last year mainly owing to reduced profitability/margin contraction plus working capital movements reflecting inventory/storage adjustments expected during investments in new stores expansion plus tariff cost absorption delays; nevertheless, liquidity remains strong at about $50 million cash & equivalents complemented by an undrawn credit line capacity exceeding $19 million post minor letters-of-credit draws providing operational flexibility through volatile cycles [S7],[S4],[S5],[S9].
Growth Prospects and Strategic Priorities
Bassett's growth vector leans heavily on leveraging its integrated value chain—domestic manufacturing supplemented by targeted imports—aligned closely with enhancing customer experience through its proprietary Design Consultant program enabling personalized home makeovers (both virtual & onsite), driving customer loyalty within its established premium positioning.
Expansion opportunities arise from:
- Scaling the Lane Venture outdoor furniture brand's distribution both via wholesale partners and company-owned retail stores recently initiated in-store placement expanding addressable markets.
- Rolling out additional company-owned stores—as evidenced by imminent openings in Cincinnati and Orlando—aimed at penetrating underserved metropolitan areas benefiting from Bassett's service-oriented model.
- E-commerce platform growth after launching an upgraded website late last year which increased user engagement metrics including page views per visitor and average order size; web sales rose by +28% quarter-over-quarter supporting omnichannel synergy without sacrificing brick-and-mortar relevance given product customization needs.
Nonetheless, growth faces constraints from:
- Continued risks around raw material pricing volatility, tariff uncertainties especially on Vietnamese sourced imports impacting input costs and pricing strategies.
- Weather-related logistics challenges evidencing potential distribution fragility if extended disruptions recur.
- Consumer discretionary spending sensitivity influenced by macroeconomic factors such as rising interest rates affecting credit availability for larger purchases typical of home furnishings.
- Profitability pressure caused by store start-up loss intervals plus SG&A cost absorption amid slower foot traffic trends possibly exacerbated by digital disruption competition.
Management’s commentary suggests ongoing cautious optimism but acknowledges these headwinds remain significant variables influencing near-term results trajectory without explicit quantitative guidance beyond capex range [$8–12 million annually] or share buyback authorizations currently maintaining circa $18 million capacity unutilized as of Q1 end [S7],[S26],[N1],[N4].
Capital Allocation and Financial Returns
Bassett maintains disciplined capital deployment prioritizing shareholder returns through dividends totaling nearly $7 million paid out in FY25 and ongoing share repurchases albeit at reduced pace than prior years highlighting prudent balancing between reinvestment needs for new store build-outs/capex expenditures (~$4–5 million spent annually now after elevated prior levels above $17 million) against returning capital amidst recovering profit metrics.
The company’s leverage profile is conservative: debt primarily consists of standby letters of credit totaling about $5.9 million secured under a revolving credit facility capped at $25 million with covenants comfortably maintained including tangible net worth requirements exceeding $120 million noted alongside lease obligations aggregating approximately $85 million discounted present value primarily related to real estate supporting retail operations ensuring long-term operational stability without undue financial strain [S4],[S5],[S11],[S15].
Approximate return measures are subdued reflecting transitional recovery stages: trailing twelve months ROE calculates roughly at ~3.7% using FY25 net income vs equity levels indicating room for improvement subject to sustained earnings momentum; free cash flow reversal positive near $9 million but dips apparent on quarterly cadence requiring monitoring going forward as capital investing ramps persist alongside business transformation costs [F1],[S7].
Industry Dynamics (Analysis)
Home furnishings remain a cyclical sector sensitive to economic conditions which influence consumer confidence and discretionary spend profiles particularly around housing market activity where new construction/tailored furnishing demand correlates directly.
The competitive landscape is characterized by large multi-channel players alongside niche manufacturers/retailers emphasizing customization or cost efficiency via offshoring; Bassett’s blend of domestic craftsmanship allied with flexible global sourcing plus owned retail stores offering personalized design consultations sets it apart though requires continuous innovation amid growing omni-channel customer expectations highlighted increasingly during pandemic-driven shifts accelerating e-commerce uptake.
Supply chain resilience has become paramount given past widespread disruptions spotlighting inventory management sophistication as critical for sustaining operational continuity without excessive working capital strain or customer fulfillment failures.
Pricing power is challenged by commodity raw materials inflation combined with consumer sensitivity necessitating delicate balancing acts around passing costs while preserving brand value perceived premium status often involving measured tariff impact timing adjustments across product lines complicating margin management further.
Risk Factors
Bassett calls out significant enterprise risks notably:
- Supply chain disruptions impacting raw materials availability/pricing complicated by tariffs/retaliatory duties on imported components especially Vietnamese sourced goods contributing over one-third wholesale revenues stressing import dependency concentration risk , [S18].
- Concentration risk stemming from substantial domestic upholstery product manufacturing making operations vulnerable to localized events such as accidents or weather disruptions threatening manufacturing availability adversely impacting lead times or cost structures.
- Retail environment uncertainties encompassing fluctuations in foot traffic attributable variously to macroeconomic shifts, competitive pressures and evolving shopping behaviors intensified further by online alternatives demanding continuous adaptation of physical store strategies including new openings balancing growth vs short-term earnings headwinds.
- Cybersecurity threats potentially disrupting IT systems critically underpinning web sales platform integration along with internal controls posing operational disruption risk necessitating ongoing vigilance overseen at Board level via CIO reporting frameworks focused explicitly on information security protocols assuring data safety standards adherence mandated under compliance regimes [S1],[S18].
What to Watch Going Forward (Analysis)
Key indicators tracking Bassett’s health will include quarterly top-line trends elucidating recovery durability post weather impact alongside improving gross margins indicative tariff pass-through efficiency stabilization plus enhancement of e-commerce penetration metrics counting toward incremental revenues complementing physical network performance.
Operating cash flow progression relative to capex deployment rates will clarify free cash generation ability relevant for future returning capital while monitoring incremental SG&A cost control effectiveness given growth initiatives like store buildouts imposing curved expense ramps should remain top management focus.
Lastly, any updates regarding tariff regulation developments or supply chain enhancements addressing bottlenecks will be critical catalyst considerations influencing both margin outlooks and operational predictability pivotal for medium term strategic execution success.
This analysis summarizes publicly available data without constituting investment advice or recommendations.
Disclaimer: This is research-only, informational analysis and not investment advice. It may include AI-generated interpretation and general industry context. Always verify important details using primary sources.
Comments