
Capstone Holding Corp’s Struggle with Profitability and Capital Constraints
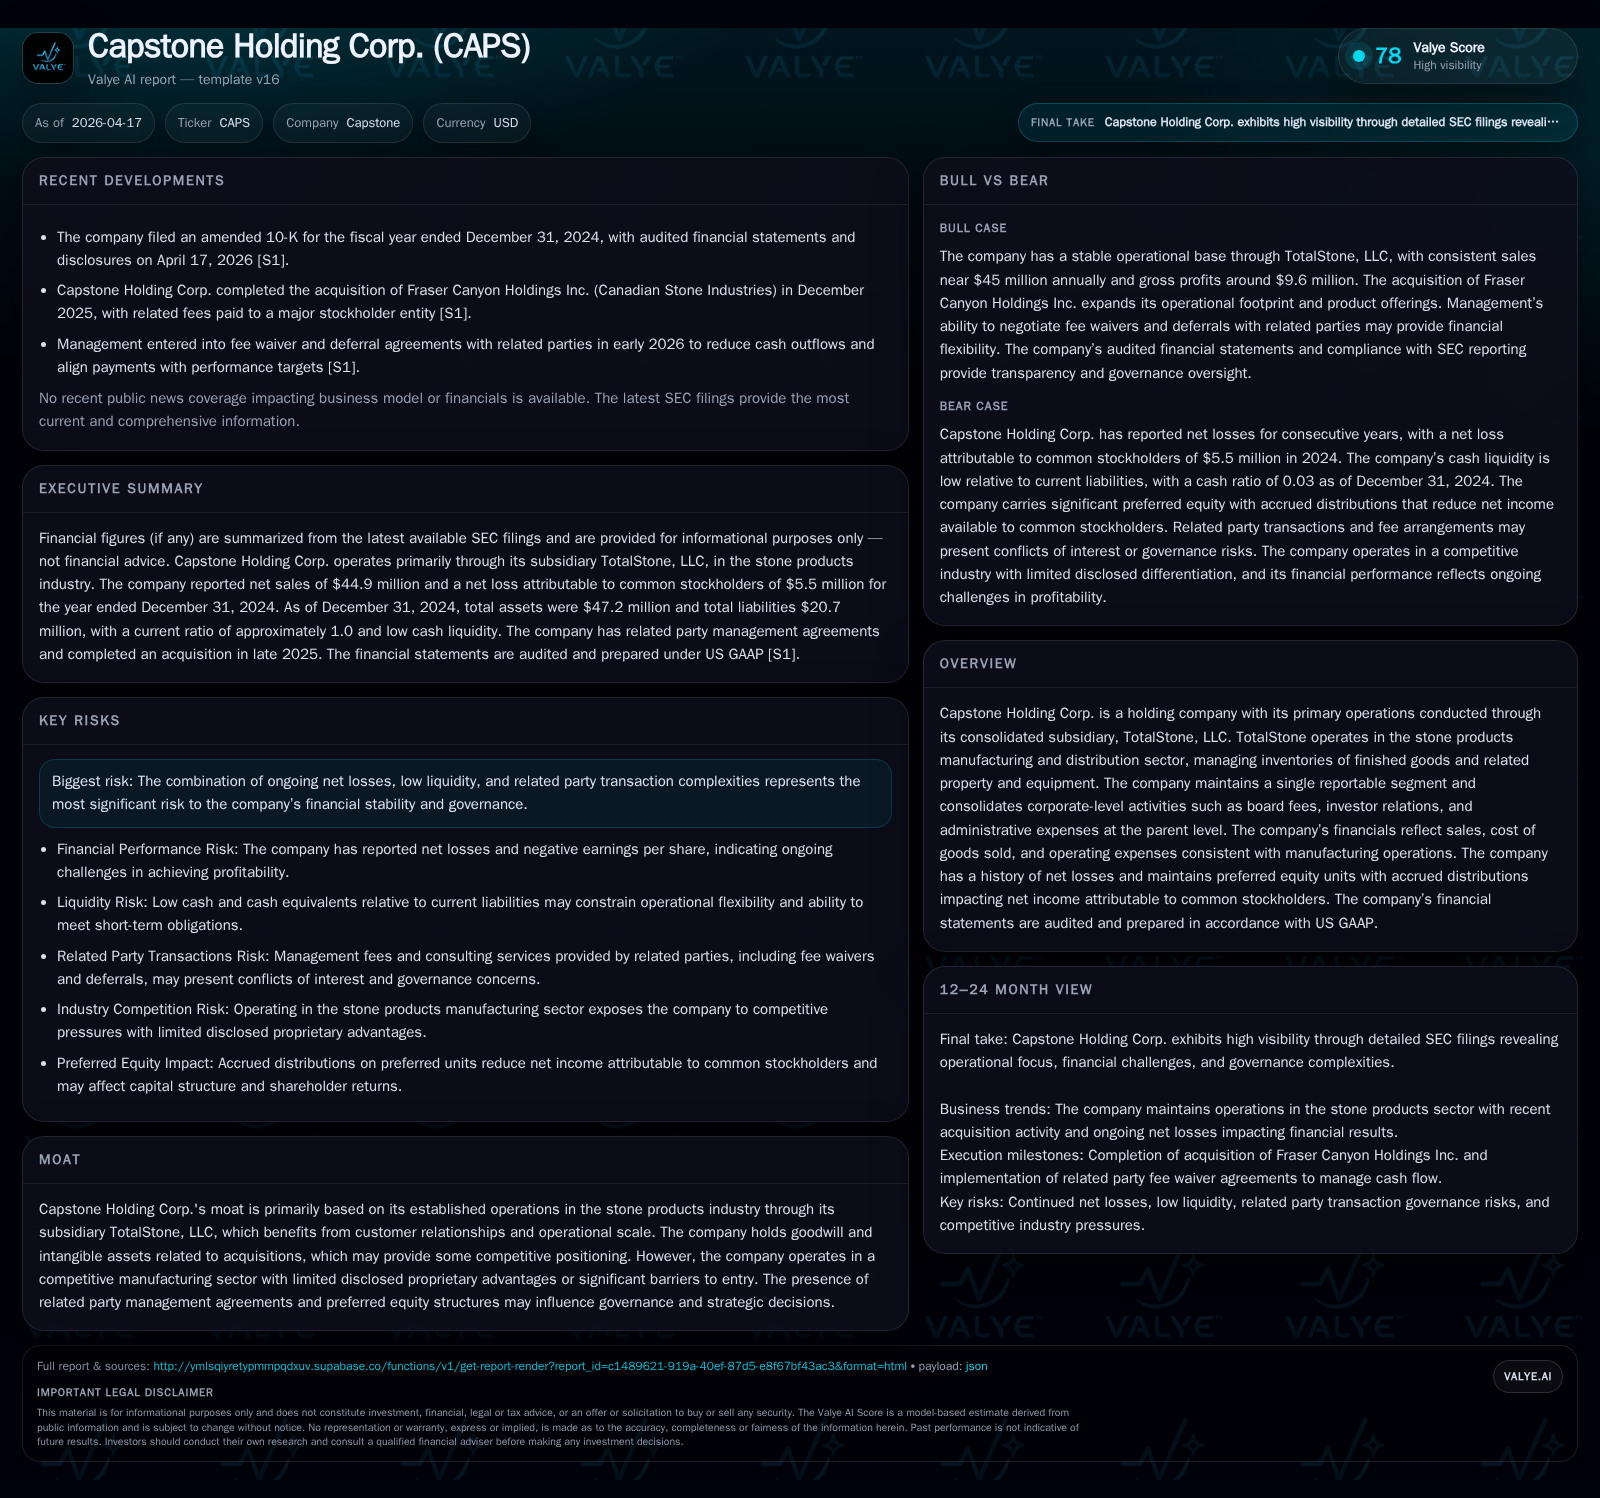
Capstone Holding Corp.’s surge in revenue contrasts sharply with escalating losses and strained liquidity, revealing tensions underlying its operational scale in the stone products sector.
Capstone Holding Corp., operating primarily through TotalStone, LLC, has experienced a remarkable top-line recovery with a 2343.8% revenue increase ending 2024. However, this growth starkly contrasts with deepening net losses reaching $21.23 million in 2025 and increasingly negative operating income. Capstone's liquidity remains constrained, evidenced by a razor-thin current ratio of 1.0 and cash reserves below $1 million. Complex capital structures involving senior secured convertible notes and preferred equity units further complicate financial flexibility and governance dynamics. Going forward, closely monitoring debt refinancing efforts, working capital management, and cost control will be critical to assess any potential shift toward profitability or continued financial strain.
Financial Performance Trajectory: Growth Shadowed by Deepening Losses
Capstone Holding Corp.’s financial trajectory tells a story of revenue expansion overshadowed by worsening profitability metrics. From a negative top-line of approximately -$2.0 million in FY2018, the company saw a dramatic increase to roughly $44.88 million by FY2024 — a striking compound recovery culminating in a YoY revenue growth of about 2343.8% as of 2024 [F1]. Despite this top-line acceleration linked to operational scaling via its subsidiary TotalStone, operating income swung negatively from a modest profit of $181 thousand (2018) to a substantial loss approximating -$10.986 million by FY2025 [F1]. The operating income decline corresponds to an even steeper net income plunge—net losses surged from ($380) thousand positive in 2018 to -$21.23 million in FY2025 representing a YoY contraction exceeding 700% [F1]. This disconnect reveals that revenues have not translated effectively into sustainable earnings due to either elevated cost structures or inefficient scaling.
Table: Historical Financial Summary (FY2018–FY2025)
Historical performance (annual)
| FY | Rev ($mm) | Net ($mm) | CFO ($mm) | OpInc ($mm) | Net YoY |
|---|---|---|---|---|---|
| 2025 | -21 | -4 | -11 | -728.3% | |
| 2024 | 45 | -3 | 4 | -1 | |
| 2018 | -2 | 0 | 0 | 0 | +121.7% |
| 2017 | -2 | -2 |
Source: SEC companyfacts cache [F1].
Capital returns and efficiency (annual)
| FY | FCF ($mm) | ROE% |
|---|---|---|
| 2025 | -5 | -170.5 |
| 2024 | 4 | 83.8 |
| 2018 | -30.5 | |
| 2017 | 199.7 |
Source: SEC companyfacts cache [F1].
Figures sourced from latest available SEC filings and company financial data [F1].
Operational Scale and Industry Context of TotalStone Subsidiary
Capstone's core operations funnel through TotalStone, LLC — its sole consolidated subsidiary engaged in manufacturing and distributing stone products for residential and commercial construction across the Midwest and Northeast US markets [S1]. The business maintains inventories of finished goods alongside prepaid inventory deposits notably held overseas, which introduces complexity into the inventory turnover cycle as foreign shipments are subject to transit delays and currency fluctuations [S17]. Moreover, the reserve for obsolete inventory nearly doubled from $324K to $576K between FY2023 and FY2024 — emphasizing challenges in inventory management amidst evolving market demand or product mix shifts [S17].
From an industry perspective, managing working capital efficiently is crucial due to high carrying costs of stone products and cyclical demand patterns tied closely to construction activity levels regionally. TotalStone's ability to optimize manufacturing yields while controlling overhead expenses directly influences margins—a linkage visible through the widening operating loss despite revenue momentum.
Liquidity Profile and Capital Structure Complexities Amid Ongoing Losses
Capstone's liquidity stance reflects tight operational cash flow conditions juxtaposed against rising short-term obligations. The company's current assets measured approximately $23 million versus near-identical current liabilities totaling roughly $22.9 million at year-end 2025 — yielding a current ratio barely above parity (about 1:1) [F1], indicating limited cushion for unexpected expenses or working capital surges.
Cash reserves stand low at just $727K as of December 31, 2025 — insufficient considering recurring cash burn indicated by negative CFO of -$4.41 million last fiscal year [F1]. Adding complexity is the company's indebtedness profile which includes a revolving credit facility with Berkshire Bank capped at $14 million but heavily drawn (~$6-8M outstanding during late 2024-25 period) under terms tied explicitly to eligible accounts receivable and finished goods collateralization [S14,S19]. Covenants were breached as of Q3-2024 but amended subsequently allowing compliance aligned with current forecasts — pointing towards ongoing stress in meeting lender requirements [S14].
Further layering is the issuance of senior secured convertible notes exceeding roughly $10.9 million principal amount at issuance during mid-to-late 2025 combined with accrued discounts lowering effective conversion prices significantly below initial levels ($0.75/share adjustments from higher starting points) indicating probable concessions made for raising funds under distressed terms [S15]. Preferred equity units issued also accrue distributions impacting earnings available for common shareholders, reducing financial flexibility to deploy capital efficiently without diluting governance or economic rights [S12].
Governance Implications of Related Party Agreements and Preferred Equity Impact
Corporate governance at Capstone features layers influenced by related party arrangements that warrant attention given their effect on strategic discretion and financial stewardship metrics. The company contracts with Brookstone Partners IAC — its majority shareholder entity — for annual consulting services amounting to $400K plus a variable management fee equal to five percent of EBITDA above certain thresholds as well as additional special service fees calculated as percentages of total consideration paid during transactions involving acquisitions or capital raises [S26,S27]. Such intertwined arrangements may create potential conflicts between maximizing shareholder value broadly versus concentrated interests tied to Brookstone’s participation.
Preferred equity units issued at TotalStone carry accrued distributions that effectively subordinate common stockholders’ economic claims — leading to notable dilution effects on net income attributable basis reported on consolidated statements [S12]. This dynamic complicates clear profit attribution and may restrict the parent company's capacity for unfettered reinvestment or dividend policy formulation until preferred claims conclude.
Analyzing Cash Flow Dynamics: Operating Losses and Investment Outflows
Despite expanded revenues enabling improved absolute operating cash inflows in prior years ($3.82M positive CFO in FY2024), fiscal year ending December 31, 2025 marked an inflection where operating cash flow turned sharply negative (-$4.41M) driven largely by increased payables settlements and perhaps extended receivables or inventory investments constraining liquidity conversion cycles [F1,S29]. Capex expenditures remained modest at around $122K both years — underscoring limited reinvestment indicative either of cautious CAPEX freezes amid losses or inherently low capital intensity associated with stone distribution assets compared to heavy-equipment dependent industries.
Operating cash flow less capex therefore resulted in a free cash flow deficit close to -$4.53 million which substantially stresses internal funding sources while potentially necessitating external financing just for working capital maintenance rather than organic growth fuels [F1] .
Capital Allocation Review: Dividends, Buybacks, and Return on Equity Deficits
Since no dividends were declared nor share repurchases executed during the referenced periods [F1,S21], Capstone’s capital allocation reflects either constraints imposed by continual operating losses or deliberate preservation of scarce cash amid uncertain outlooks—likely both given fiscal context.
Return on equity stands extremely depressed at approximately negative -170% reflecting disproportionate net losses relative to shareholders’ equity base which itself turned positive from prior negatives post recapitalizations yet remains fragile at just $12.45M as of FY2025 end [F1]. This metric signals severe erosion of common stockbook value driven by sustained earnings deficits compounded by financing costs tied to convertible notes and preferred unit distributions.
Forward-Looking Considerations: Potential Catalysts and Warning Signs to Monitor
Absent explicit management-provided forecasts within filings or known guidance disclosures (no recent press releases cited) investors should focus on several key indicators moving forward:
- Debt Refinancing/ Covenant Compliance: Maturity extensions or renegotiations on revolving credit facilities due mid-2026 will be pivotal; failure could trigger liquidity crises.
- Working Capital Optimization: Improvements reducing obsolete inventories/reserves or shortening receivables cycles would alleviate cash flow pressures.
- Cost Control Initiatives: Any disclosed restructuring aimed at tackling bloated SG&A or production inefficiencies could shift operational leverage toward break-even points.
- Integration Success: The recently acquired Fraser Canyon Holdings Inc.’s assimilation poses both potential revenue synergistic uplift opportunities yet integration risk given existing resource constraints [S24].
- Capital Raising Actions: Further issuances dilutive convertible notes or preferred shares could heighten governance burdens while preserving solvency.
Careful tracking through forthcoming quarterly filings shall yield signs whether Capstone can navigate its profitability challenges or if entrenched structural issues persist without remedial strategic maneuvers.
This report synthesizes publicly available SEC filings as of April 17, 2026 without reliance on speculative forward-looking statements beyond clearly labeled analysis sections intended solely for informational purposes without investment advice.
Disclaimer: This is research-only, informational analysis and not investment advice. It may include AI-generated interpretation and general industry context. Always verify important details using primary sources.
Comments