
Clean Energy Technologies Expands European Footprint Amid Nasdaq Compliance Challenges
CETY pursues growth through strategic partnerships and investments in clean energy projects, while navigating listing risks.
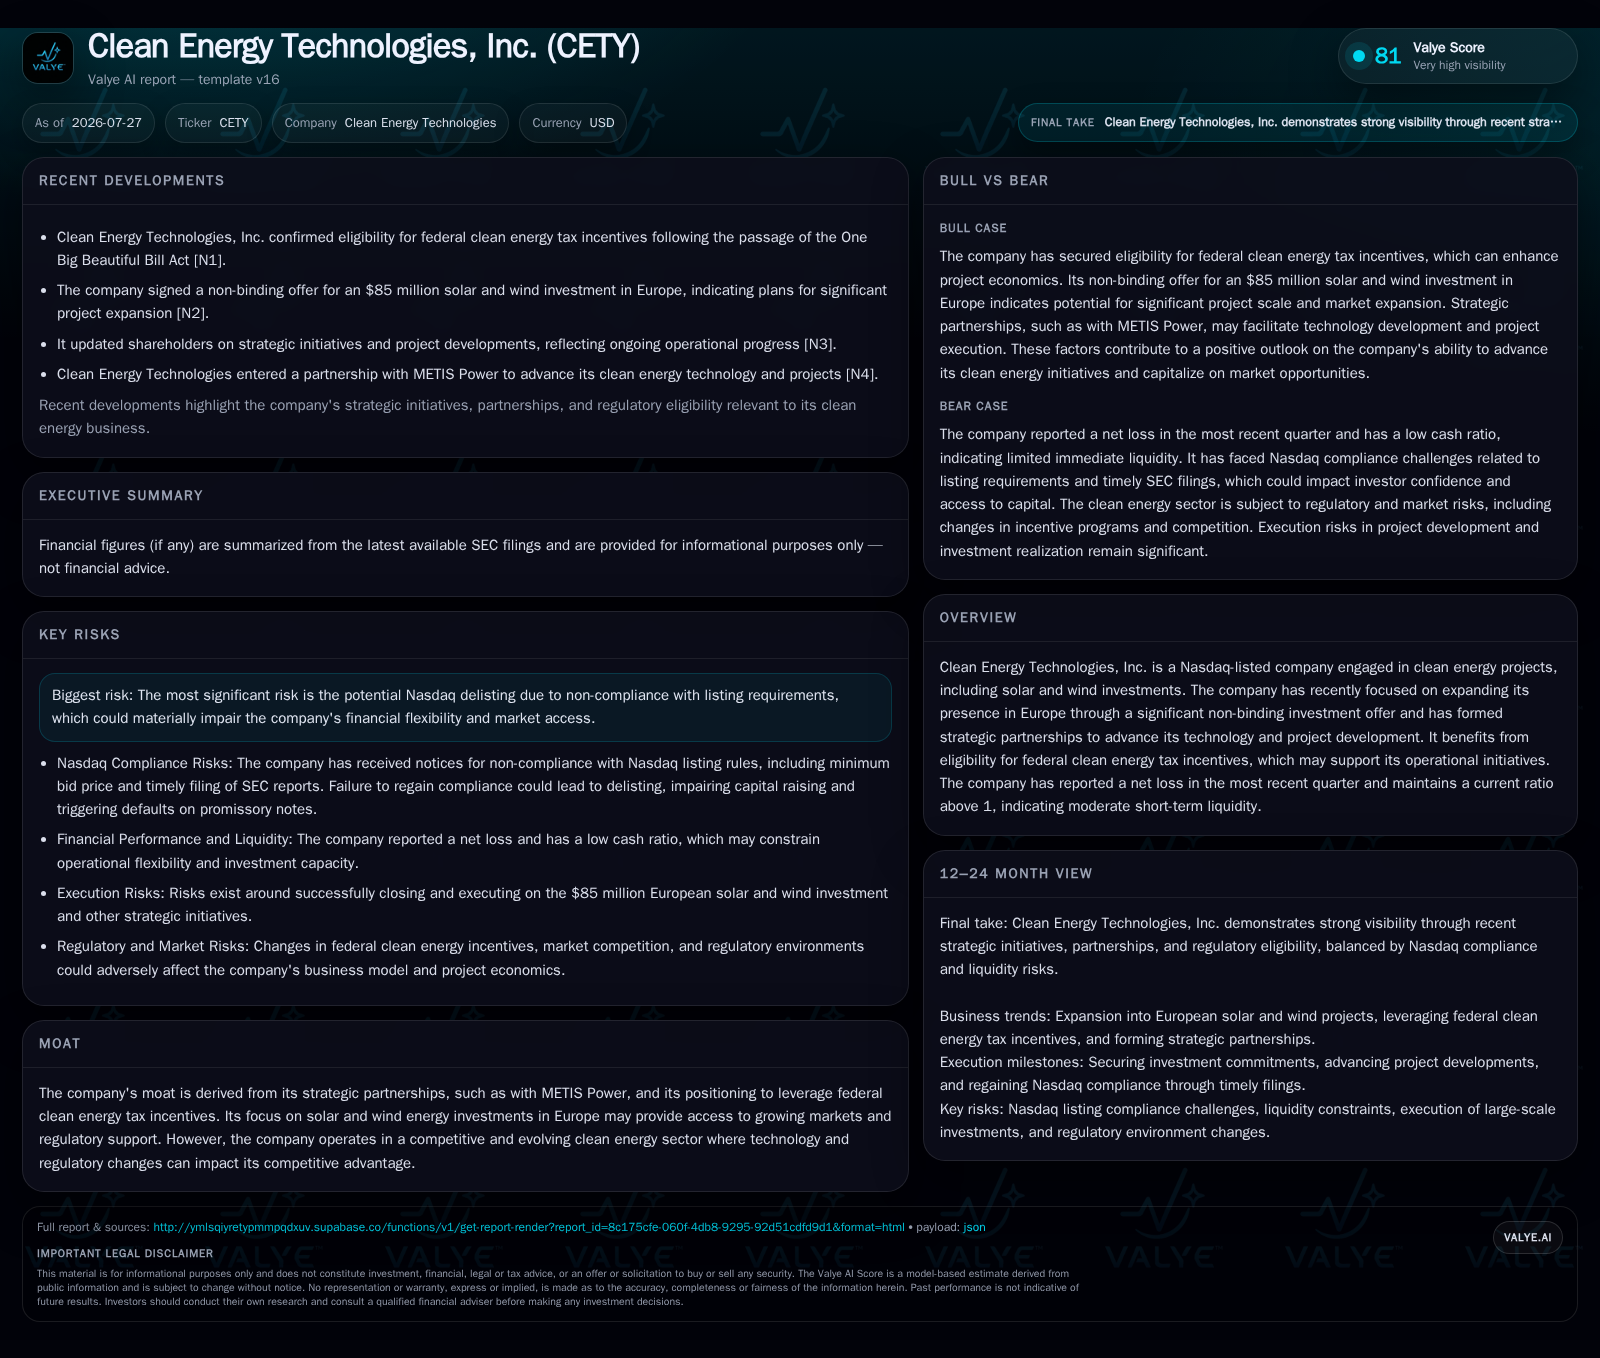
Clean Energy Technologies, Inc. (CETY) continues to develop its clean energy project portfolio with a focus on solar and wind investments in Europe, supported by strategic alliances like METIS Power and eligibility for federal tax incentives. The company reported a net loss in the latest period but maintains moderate liquidity with a current ratio of 1.15. However, ongoing non-compliance with Nasdaq listing requirements poses significant risk to capital access and operational flexibility. Monitoring execution of growth initiatives and Nasdaq’s response to compliance plans will be critical going forward.
Recent Operating Update
Clean Energy Technologies, Inc. (CETY) released its latest quarterly report on July 27, 2026 [S2], reflecting ongoing operational challenges alongside strategic moves directed at expanding its clean energy footprint. The company remains engaged in solar photovoltaic (PV) and wind power project development with an emphasis on the European market via a significant non-binding investment offer announced earlier this year [S1]. This geographic expansion aligns with growing regional demand driven by evolving sustainability regulations and government incentives.
However, the company disclosed receiving multiple notices from Nasdaq regarding non-compliance with listing standards, including delayed filing of required periodic reports [S21], alongside past minimum bid price breaches that necessitated remedial plans and extensions [S2][S22]. Failure to regain compliance risks delisting that could severely restrict capital markets access and trigger defaults under existing promissory notes [S22]. CETY is currently pursuing plans to address these issues but faces material uncertainty in this regard.
Business Model
CETY operates principally as a renewable energy project developer focusing on owning and operating solar PV and wind turbine assets. Its monetization model primarily involves selling electricity generated to utilities or other buyers under power purchase agreements (PPAs), which provide predictable revenue streams over long contract durations. The company also leverages federal tax incentives such as Investment Tax Credits (ITCs) which significantly enhance project return profiles by lowering effective capital costs.
The value chain role centers on project development—encompassing site selection, permitting, grid interconnection arrangements—and asset management post-construction. Given the sector’s capital-intensive nature, CETY actively forms strategic partnerships to bolster its technical capabilities and secure financing. One notable collaboration is with METIS Power, potentially providing advanced technology platforms or expert project management support [S1], a key differentiator amidst competitive pressures.
Revenue triggers depend on installed capacity increases (measured in MW), asset commissioning milestones, operational uptime ensuring generation consistency, and PPA contract execution securing price stability. At present, CETY’s operating losses highlight an investment-heavy stage before substantial generation and revenue scale accrues. Margins are likely negative due to developmental opex outweighing nascent revenue inflows.
Industry Structure and Competitive Position
The clean energy industry is characterized by rapid technological innovation alongside shifting regulatory landscapes impacting subsidy frameworks and grid integration rules. Companies ranging from large-scale independent power producers (IPPs) like NextEra Energy to specialized solar firms like First Solar illustrate diverse competitive archetypes focusing on scale advantages or technology leadership.
CETY remains relatively small-scale compared to major peers but benefits from targeted European expansion where government policies increasingly mandate renewable adoption. Its partnership model leveraging METIS Power aims to bridge capability gaps while improving project pipeline viability. However, broader industry competition intensifies as numerous entrants vie for limited premium sites with high capacity factors (~25-35% for wind; ~15-25% for solar generally), robust grid access, and creditworthy offtakers.
Sector KPIs such as installed capacity growth rate, levelized cost of energy (LCOE), PPA coverage ratios, and project commissioning timelines are critical benchmarks. Due to limited disclosures on these metrics for CETY so far, external validation through future filings or investor communications will be necessary to gauge competitive positioning sustainably.
Growth Drivers
Global decarbonization initiatives underpin increasing demand for clean electricity generation capacity—an overarching tailwind propelling sector expansion. Government subsidies including tax incentives lower entry barriers enabling new projects to realize economic feasibility amid falling capital expenditure per MW due to technological advances.
CETY’s focus on Europe taps into markets with favorable policy environments reinforcing renewables competitiveness against fossil alternatives. Strategic alliances facilitate better access to financing structures mitigating the inherent risks associated with development delays or permitting hurdles.
Corporate sustainability commitments globally further buoy demand for renewable attributes embedded in product sourcing or operations supply chains—potentially expanding off-taker bases beyond traditional utility customers.
Technological enhancements driven through partnerships like that with METIS Power can reduce operating expenses per MWh generated and improve capacity factors by optimizing asset performance.
Risks and Constraints
The most immediate risk emanates from Nasdaq listing non-compliance. Persistent delays in required filings threaten delisting that would restrict equity capital raisings critical for funding construction phases—a key liquidity constraint given the industry's upfront capital needs [S22]. Delisting may also trigger debt acceleration clauses worsening balance sheet pressures.
Project execution risks including permitting setbacks or technology underperformance could amplify financial losses or defer cash flows essential for operations scaling.
Competitive dynamics also impose pressure: larger peers benefit from scale economies enabling lower LCOE; stronger balance sheets allowing more aggressive bidding for sites; and established customer relationships aiding PPA procurement.
Regulatory uncertainties remain prevalent especially around subsidy continuity or carbon pricing mechanisms that materially affect underlying economics.
Furthermore, the company's historical accounting restatements concerning receivables classification introduce reputational considerations potentially affecting investor confidence [S16].
What to Watch Next
Key milestones include CETY's ability to finalize its European investment commitments converting non-binding offers into actionable projects. Tracking announcements on installed capacity additions or successful PPA signings will shed light on commercialization steps.
Regulatory filings related to Nasdaq compliance plans will be pivotal — acceptance by Nasdaq or appeals outcomes directly influence access to public equity markets.
Updates around execution progress with METIS Power and any disclosures regarding pipeline size or commissioning schedules will clarify operational advancement.
Financial statements revealing improvements in gross margins or movement toward EBITDA breakeven would indicate positive momentum toward sustainable operations.
Additionally, monitoring broader trend developments such as shifts in federal clean energy tax policy or regional subsidy schemes affecting operating cost baselines will affect strategic outlooks.
Financial Profile Discussion
Capital expenditures likely remain significant given ongoing project development activities characteristic within this segment where front-loaded capex dictates near-term cash outflows preceding steady state revenue capture after commissioning milestones.
Nasdaq compliance issues introduce refinancing risk: should delisting occur triggering defaults under existing convertible promissory notes [S22], forced acceleration of liabilities could strain solvency absent alternative financings swiftly arranged.
Going forward, generating free cash flow remains aspirational until sufficient commissioned asset base enables positive operating income contributions balancing capex demands.
This analysis is based solely on publicly available SEC filings up to July 27, 2026 [S1][S2][S3][F1] without predictive investment insights. Readers should consider additional sources for comprehensive evaluation of Clean Energy Technologies' strategic positioning within the evolving renewable energy landscape.
Disclaimer: This is research-only, informational analysis and not investment advice. It may include AI-generated interpretation and general industry context. Always verify important details using primary sources.

Comments