
Community Healthcare Trust’s Evolution: Portfolio Focus, Market Exposure, and Return Dynamics
Community Healthcare Trust leverages a specialized healthcare real estate strategy balancing geographic concentration with tenant diversification amid regulatory complexities.
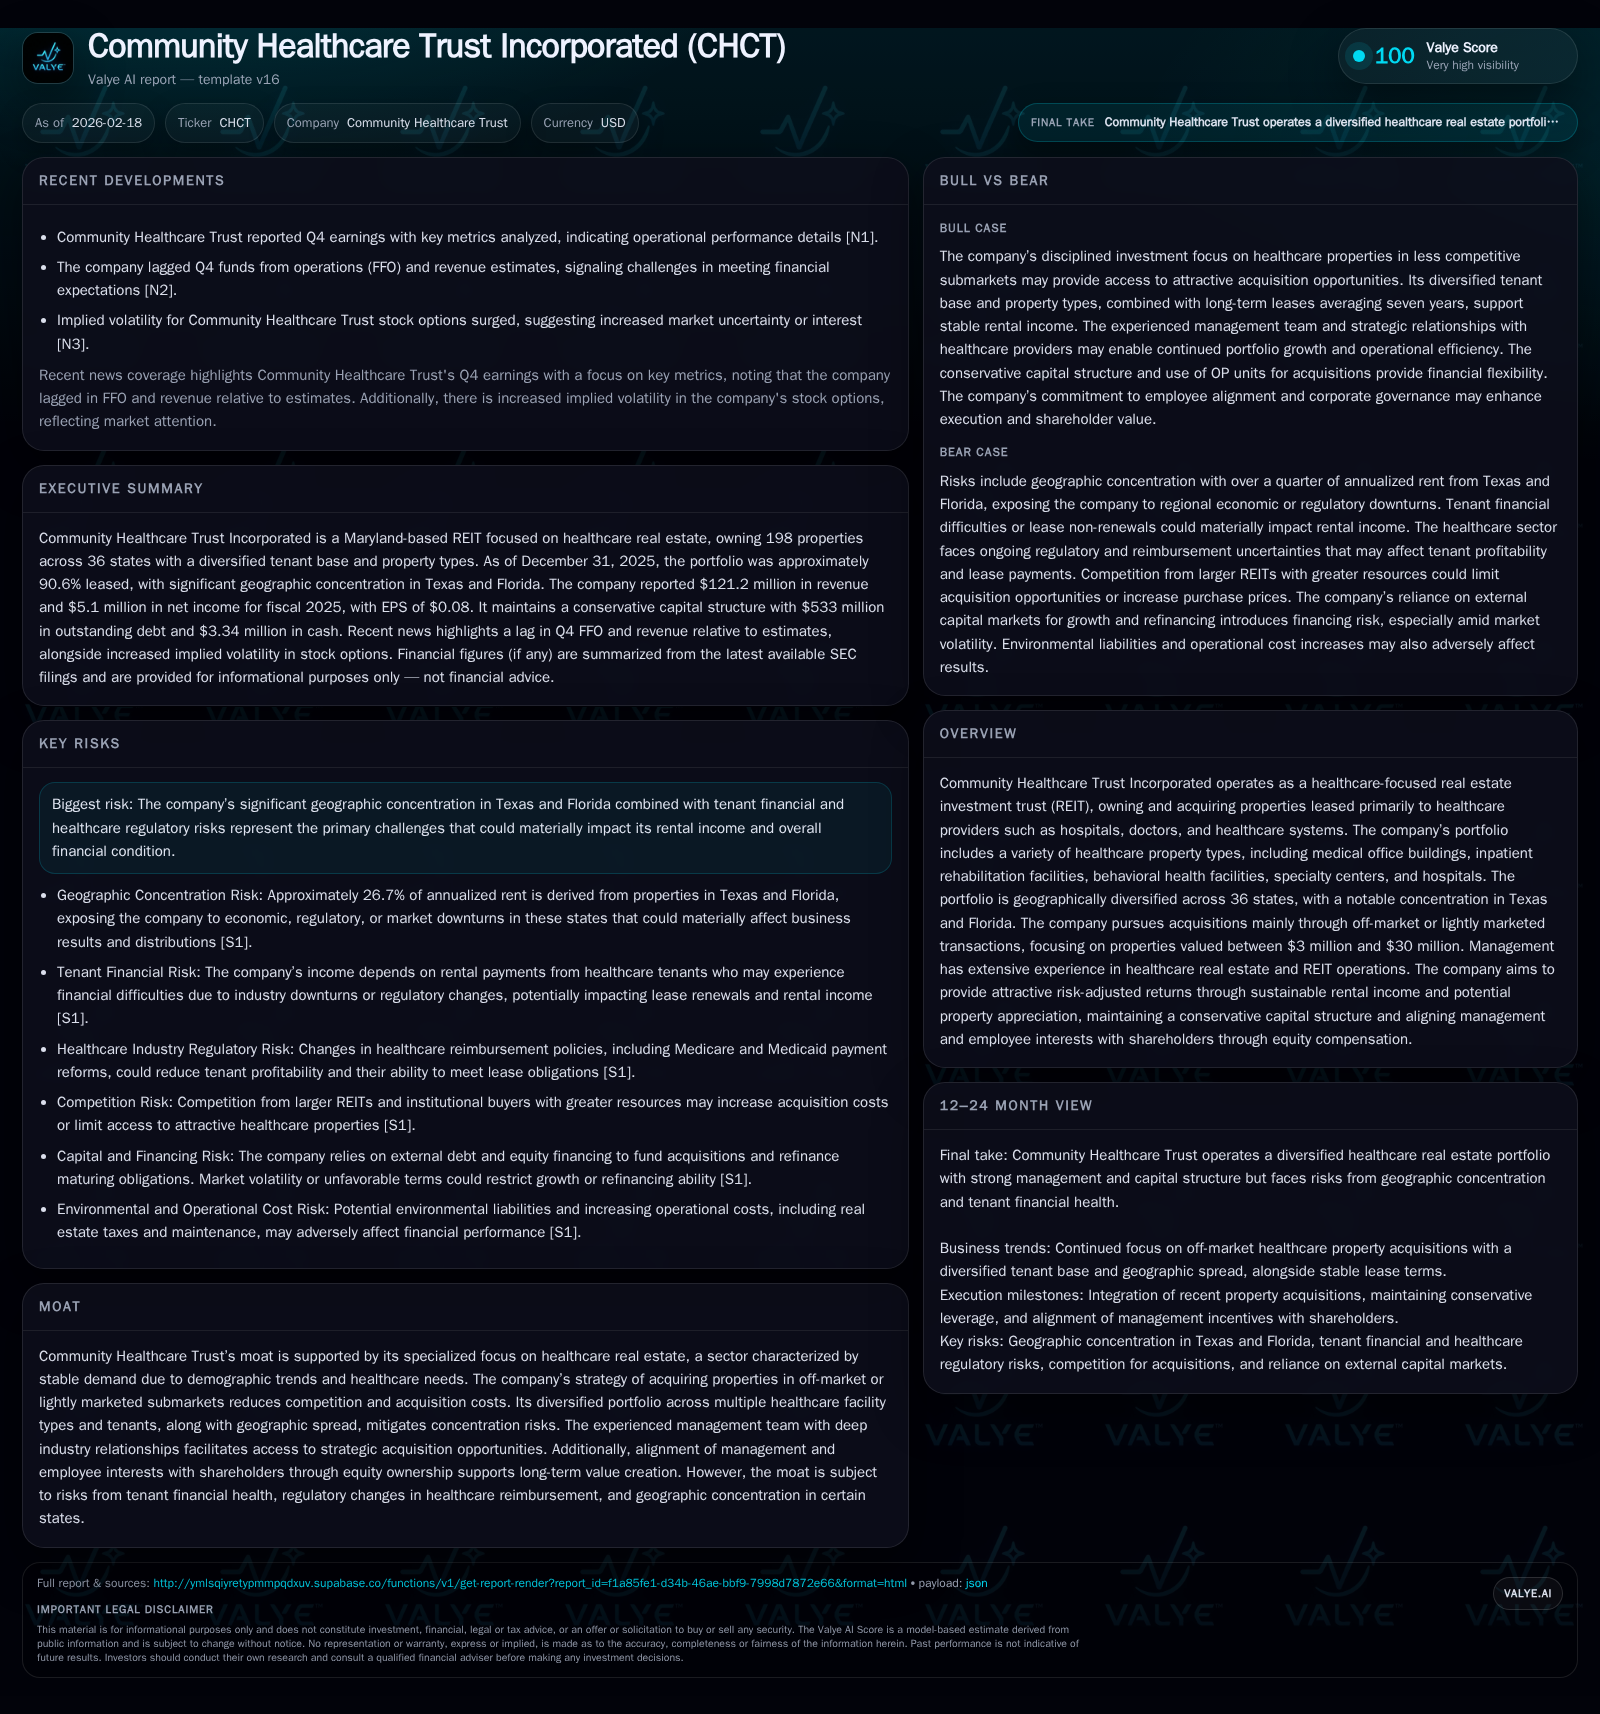
Community Healthcare Trust Inc (CHCT) has steadily grown revenues through consistent portfolio expansion focused on healthcare properties leased to diverse tenants across 36 states. While the company benefits from a weighted average lease term of seven years and off-market acquisition strategy, geographic concentration in Texas and Florida raises risk exposures. CHCT’s financial metrics reveal modest net income but robust operating cash flows supporting healthy free cash flow generation despite increased capital expenditures. Regulatory pressures on tenant reimbursement and legal compliance remain key risks necessitating ongoing surveillance. The firm’s capital allocation reflects prudent debt management, absence of buybacks, and dividend distributions aligned with REIT mandates, positioning it for measured growth contingent on market and legislative developments.
Discussing Community Healthcare Trust’s Historical Performance and Growth Drivers
Community Healthcare Trust Incorporated (CHCT) has demonstrated steady topline growth over recent years. Revenue increased from approximately $97.7 million in FY2022 to $121.2 million in FY2025, representing a compounded annual growth trajectory underpinned by strategic acquisitions concentrated primarily within the healthcare sector [F1]. Despite this revenue growth, net income has been more volatile — peaking at $22 million in FY2022 before declining sharply to a loss of $3.18 million in FY2024 but recovering to a modest profit of approximately $5.1 million in FY2025 [F1]. This volatility points toward inherent challenges in balancing operating expenses and the nuanced profitability profile typical of REITs focusing on healthcare properties.
Operating cash flow has remained comparatively resilient, holding near the $60 million mark annually through the same period [F1], indicative of stable cash generation capacity from core leasing operations against capex outlays.
Historical performance (annual)
| FY | Rev ($mm) | Net ($mm) | CFO ($mm) | Capex ($mm) | Rev YoY | Net YoY |
|---|---|---|---|---|---|---|
| 2025 | 121 | 5 | 56 | 7 | +4.7% | +260.4% |
| 2024 | 116 | -3 | 59 | 5 | +2.6% | -141.2% |
| 2023 | 113 | 8 | 61 | 4 | +15.5% | -65.0% |
| 2022 | 98 | 22 | 60 | 4 |
Note: Omitted columns lack sufficient annual XBRL coverage in the provided tags (need ≥2 annual points): OpInc, Div, Buybacks. Source: SEC companyfacts cache [F1].
Capital returns and efficiency (annual)
| FY | FCF ($mm) | ROE% |
|---|---|---|
| 2025 | 50 | 1.2 |
| 2024 | 54 | -0.7 |
| 2023 | 57 | 1.5 |
| 2022 | 56 | 4.4 |
Source: SEC companyfacts cache [F1].
Note: Operating income data not available in provided tags; Buybacks data unavailable.
Portfolio Composition and Geographic Exposure: Strengths and Vulnerabilities
At December 31, 2025, CHCT held gross investments nearing $1.2 billion distributed across 198 properties spanning approximately 4.5 million square feet [S1]. Medical Office Buildings (MOBs) comprise the largest segment, accounting for roughly 36% of annualized rent, followed by inpatient rehabilitation facilities (21%) and acute inpatient behavioral health facilities (12.6%), among others [S4]. The portfolio enjoys a weighted average remaining lease term of around seven years and maintains about a 90+% occupancy rate excluding assets held for sale [S1]. This diversified property type mix provides some insulation from sector-specific demand shocks.
Geographically, while the portfolio spans thirty-six states, nearly a quarter of rent rolls originate from Texas (14.3%) and Florida (12.4%), exposing CHCT to potential headwinds stemming from those state economies or localized real estate cycles [S4],[S26]. The company explicitly notes this concentration as a material risk factor due to possible economic downturns or changing market dynamics impacting rental rates or occupancy levels.
Tenant Base Quality and Regulatory Environment Impacts
Tenant diversification is robust — no single tenant contributes more than 10% of total annualized rent as of year-end fiscal 2025; the largest contributors are US Healthvest (7.3%) and Lifepoint Health (6.4%) [S1]. The tenant roster includes well-known healthcare providers like Adventist HealthCare, Tenet Healthcare Corporation, Fresenius Medical Care AG & Co., among others.
Nonetheless, tenant credit quality faces challenges intrinsic to healthcare real estate: sites rely heavily on reimbursement policies from Medicare, Medicaid, and private insurers whose evolving payment models may compress profitability [S15],[S20],[S22]. Adverse regulatory actions such as governmental fraud investigations or compliance failures can jeopardize tenant financial stability — risking delayed or missed rent payments [S7],[S9]. Additionally, tenants confront increasing exposure to cybersecurity risks given the sensitive nature of protected health information maintained under HIPAA regulations [S27].
The site-neutral reimbursement initiatives by CMS have introduced payment parity between hospital-based outpatient clinics versus physician offices which could impact rental values depending upon property type location relative to campuses [S10],[S23].
Recent Earnings Highlights and Financial Metrics Review
Earnings released for Q4 ended December 31, 2025 indicated that CHCT lagged consensus estimates with respect to Funds From Operations (FFO) and revenues [N1],[N2]. The shortfall was attributed partly to operational stress possibly linked with tenant credit concerns or unexpected expense increases.
Simultaneously, options market data revealed rising implied volatility around CHCT's share price post-earnings release — hinting at heightened investor uncertainty regarding future cash flows or strategic direction [N4].
From a financial health perspective, operating cash flow has sustained near $56-million levels despite sharp increases (+42%) in capital expenditures reflecting investments into property upkeep or modernization [F1],[N1]. Capital discipline appears strict with no reported buybacks during this period which aligns with maintaining liquidity amid uncertain market conditions [F1],[S6],[S8].
Capital Allocation Framework: ROE, Cash Flow Insights, Dividends, and Shareholder Returns
CHCT evidences modest profitability with an estimated ROE at around ~1.2%, reflective of typical REIT challenges where large non-cash depreciation charges affect net income despite strong cash flow [F1]. Free Cash Flow (operating cash flow minus capex) remains solid at near $49.9 million in FY2025 underscoring operational efficiency even amid rising spending demands.
The company complies with REIT distribution mandates requiring payout of at least 90% taxable income annually; dividend payments thus form a significant use of available cash though exact recent dividend data is not detailed in provided filings [F1],[S6]. With no observable stock repurchase programs disclosed recently, capital allocation prioritizes sustaining liquidity and supporting acquisitions rather than shareholder returns via buybacks.
Debt management is notable — total indebtedness stands just below a self-imposed cap at about ~43% of total capitalization as per amended policies effective October 2024 [S24],[S29]. However, nearly one-third comprises variable-rate debt exposing the company to interest rate volatility risks unless mitigated through hedging strategies which might be partial or ineffectual [S25]. Stringent covenants restrict operational flexibility but provide downside protection for creditors.
Growth Prospects: Acquisition Strategy and Market Opportunities
Acquisitions remain central to CHCT's growth thesis: management focuses predominantly on off-market or lightly marketed opportunities involving assets valued between approximately $3 million and $30 million predominantly targeting medical office buildings alongside specialty healthcare facilities [N1],[N2],[S1]. This niche sourcing approach reduces competition-driven price inflation common among larger deals while capitalizing on management's deep industry relationships.
Such deal sourcing helps buffer against oversupply but constrains rapid scaling potential as asset availability is inherently limited by subdued market marketing intensity—as opposed to broader commercial real estate sectors where deal volume is higher.
The management team’s background combining investment banking expertise with healthcare REIT specialization supports disciplined underwriting minimizing integration risks intrinsic to fragmented acquisitions [S29]. Success will likely depend on continued stable financing access given competitive pressures for quality assets intensified by rising interest rates.
Key Risks: Tenant Financial Stability, Regulatory Shifts, and Geographic Concentration
Primary risk vectors stem from tenant credit profiles reliant on timely reimbursements increasingly influenced by evolving federal/state legislation including site-neutral payment adjustments reducing revenue streams for certain facility types [S5],[S7],[S9],[S10],[S15],[S16]. Increasing enforcement actions around fraud claims introduce legal uncertainties heightening the possibility of rent collection disruptions.
Geographic concentration primarily within Texas and Florida elevates vulnerability to localized economic downturns or adverse regulatory changes impacting those markets disproportionately relative to national averages [S26]. Localized health system consolidations could further compress rents.
Environmental liabilities tied to property ownership historically unnoticed could impose unanticipated remediation costs reducing net asset values [S14]. Cybersecurity threats squaring off against tenant compliance needs may impose incremental costs affecting operating margins indirectly impacting lease renewal dynamics.
Forward-Looking Analysis: What Investors Should Monitor
Absent explicit future guidance beyond historical patterns, observers should track:
- Lease renewal rates—especially upcoming expirations among top tenants representing over ~13-15% combined rent concentrations,
- Acquisition pipeline evolution—notably any shift toward larger or more high-profile assets,
- Legislative developments surrounding Medicare/Medicaid reimbursement reforms notably site-neutral policy expansions,
- Interest rate trajectory affecting variable-rate debt service burden,
- Tenant health indicators particularly those undergoing government scrutiny or litigation,
- Capital markets openness influencing refinancing capability given significant maturing debt burdens. These parameters will crucially shape CHCT’s ability to sustain distributable cash flow growth while managing downside stresses from concentrated exposures.[N1],[N2],[S25]
Summary: Balancing Specialized Focus Against Sector Headwinds
Community Healthcare Trust Inc upholds a defensible moat rooted in its concentrated yet diversified portfolio within healthcare real estate—marked by strategic acquisition focus on lightly marketed properties stitched together under seasoned management stewardship. This specialization leverages demographic secular trends supporting steady demand despite cyclical fluctuations evident in profitability metrics such as ROE hovering near the low single digits.
While robust operating cash generation buttresses capital allocation priorities favoring dividends alongside targeted acquisition efforts, material headwinds loom via complex regulatory environments constraining tenant performance coupled with geographic concentration risks centered on Texas and Florida markets.
Prudent capital structure discipline tempers leverage-induced risks although fluctuating interest rates could pressure future earnings absent effective hedging arrangements.
In sum, CHCT embodies a carefully balanced play within healthcare real estate demanding vigilant oversight around legislative changes and tenant health trajectories; its evolutionary path hinges critically on measured portfolio expansion while navigating stringent governance frameworks endemic to specialized REIT operators.
Disclaimer: This analysis is for informational purposes only based on available corporate filings and public disclosures as of February 18, 2026; it does not constitute investment advice.
Disclaimer: This is research-only, informational analysis and not investment advice. It may include AI-generated interpretation and general industry context. Always verify important details using primary sources.
Comments